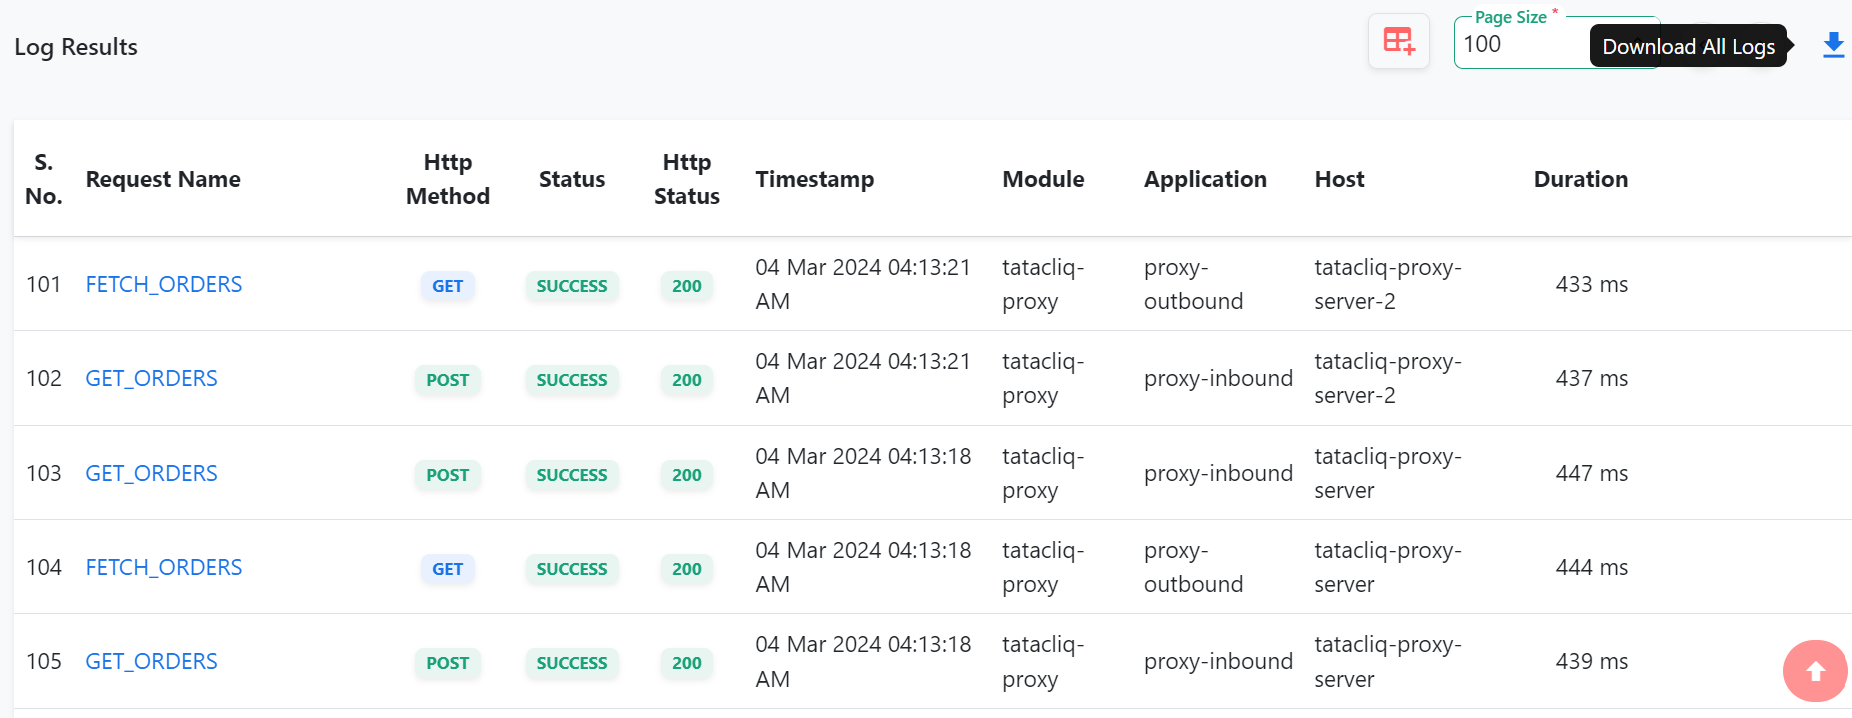
Log Viewer
The Log Viewer provides a comprehensive set of features for viewing and managing logs. Logs can be required by the marketplace, ERP, Webshops, brand.coms, POS systems for troubleshooting any issues.
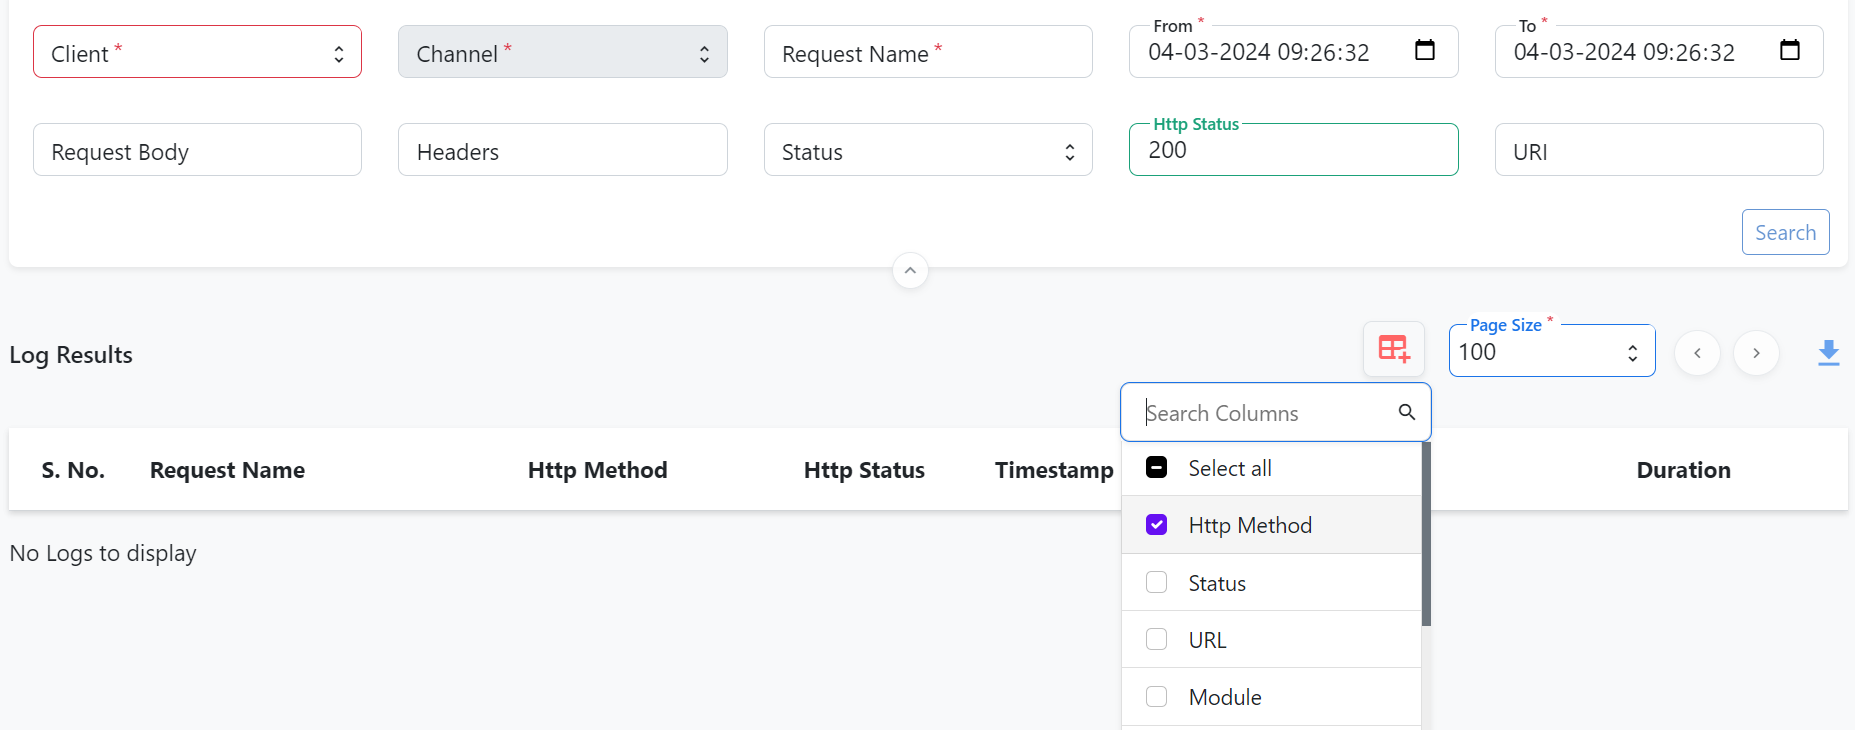
The logs can be searched based on various parameters such as Client, Channel, Request Name, From Date, To Date, Request Body, Headers, Status, HTTP Status, and URI.
Users can expand log results and copy, download, or generate a link for a specific log.
Additionally, they can configure displayable columns, manage page size, and download all logs. The ELK Log UI Requirements provide details about fetching the list of client IDs and fetching the logs from ELK.
Granting access to view logs
Please follow the below steps for granting the view logs access to the user:
Go to Manage users

If the user already exists, search for the user's name.

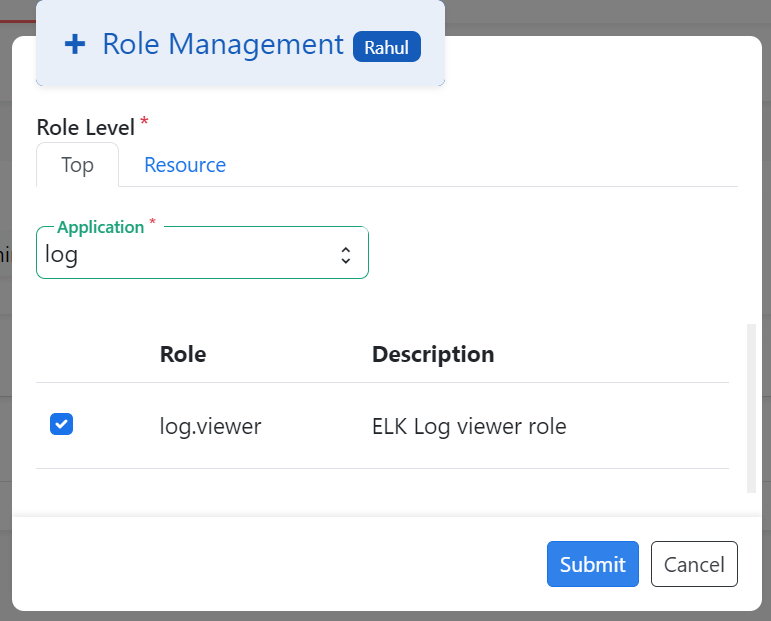
In Role Management, choose the application as log.
Give Role log.viewer for enabling logging access to the user.
Next, go to the home page and choose the Log Application. The below window reflects.
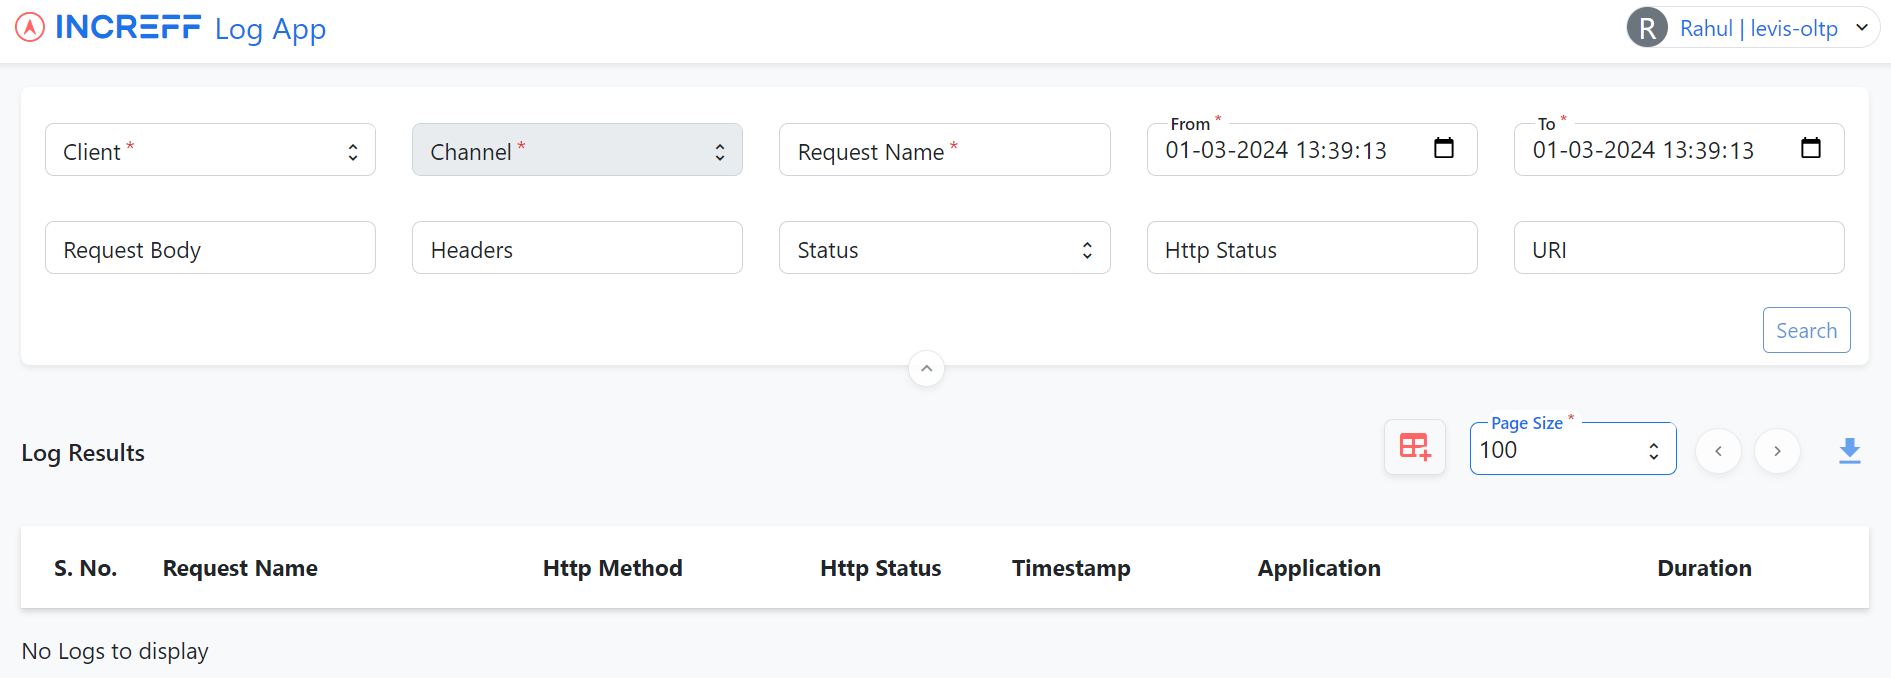
Searching the Logs
The logs can be searched based on the following parameters:
Mandatory Fields
Client: Select the OMS client Name from drop down.
Channel: This specifies the channel for which the logs are required. Channels can represent ERP, Marketplace, POS or External Fulfillment System.
Request Name: For users looking to find logs related to specific requests, this field allows the input of the request name. If the exact name is unknown or if a broader search is desired, an asterisk (*) can be used as a wildcard character to include all possible matches.
From Date and To Date: These parameters define the temporal boundaries of your search. "From Date" is the starting point of the time range, while "To Date" marks its conclusion. Together, they allow users to search for logs within a specific timeframe, which is particularly useful for troubleshooting issues or analyzing events that occurred during a particular period.
Non-Mandatory Fields
Request Body: Although optional, this field can be used to search for logs that contain specific information within the request body. It's useful for detailed analyses or when looking for logs that match certain criteria within the request content.
Headers: Searching by headers can help in identifying logs that came with specific header information. This is useful for debugging or verifying that the correct headers were used in requests.
Status: This parameter allows for the filtering of logs based on the status of the request. Status can be SUCCESS, FAILURE, or WARNING. It can help in quickly identifying failed requests or requests with warning.
HTTP Status: Similar to the Status field, this allows for filtering based on the HTTP status code returned by the request. It's particularly useful for web services troubleshooting, where understanding the nature of HTTP responses (e.g., 200 OK, 404 Not Found) is critical.
URI: For searches focused on specific endpoints or resources, the URI parameter can be used to locate logs related to particular URIs. This is beneficial when analyzing the traffic or issues related to specific parts of a service.
Understanding and utilizing these search parameters effectively can significantly enhance your ability to find and analyze the necessary logs, aiding in troubleshooting and analysis.
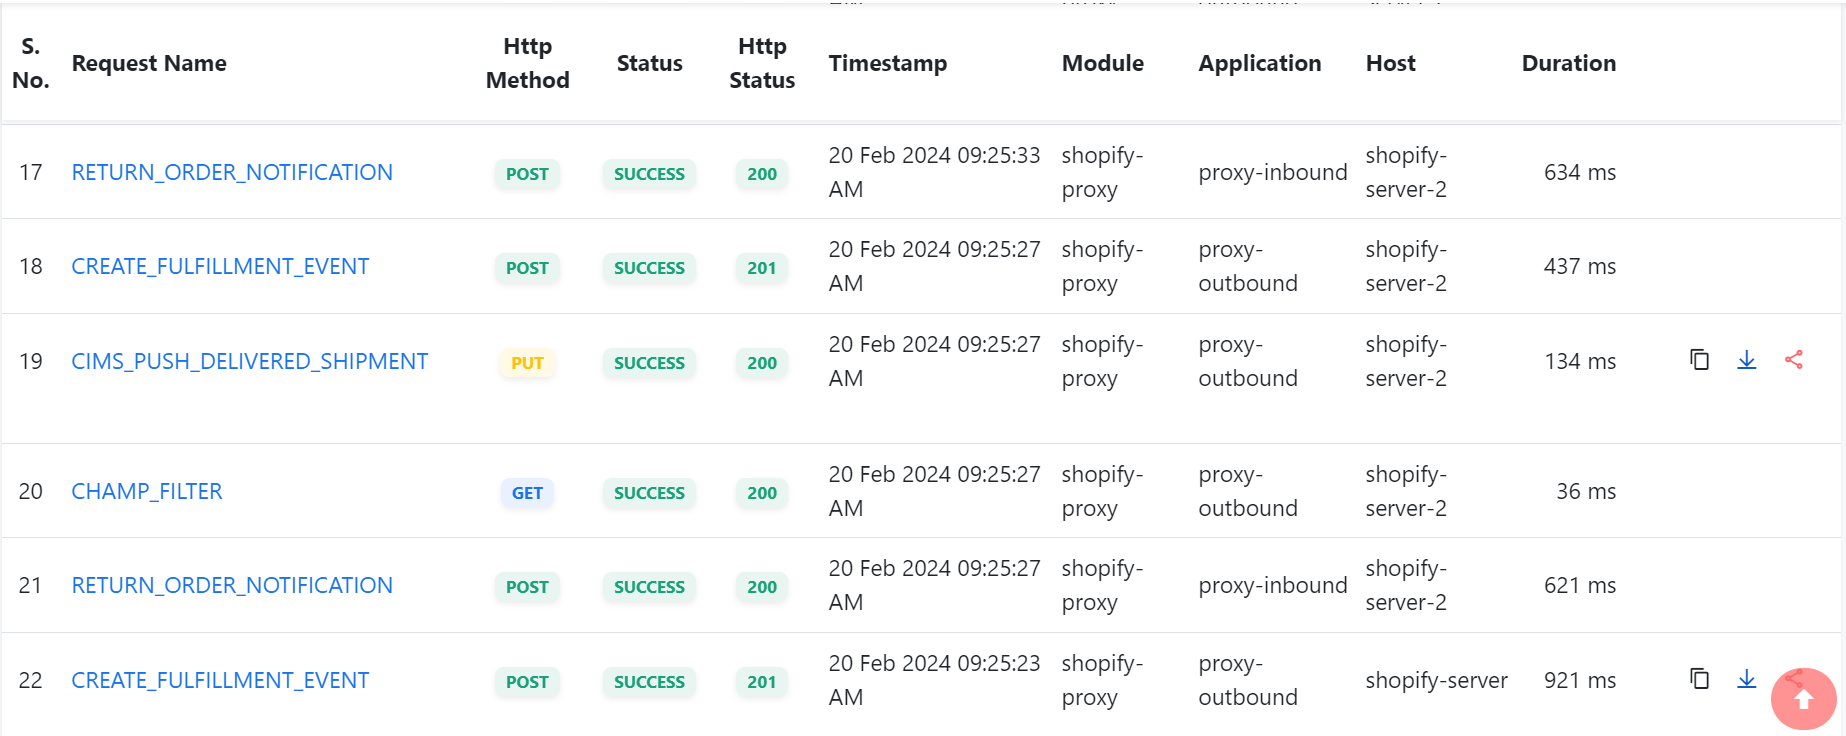
On click of the Search button, the results are displayed as shown below.
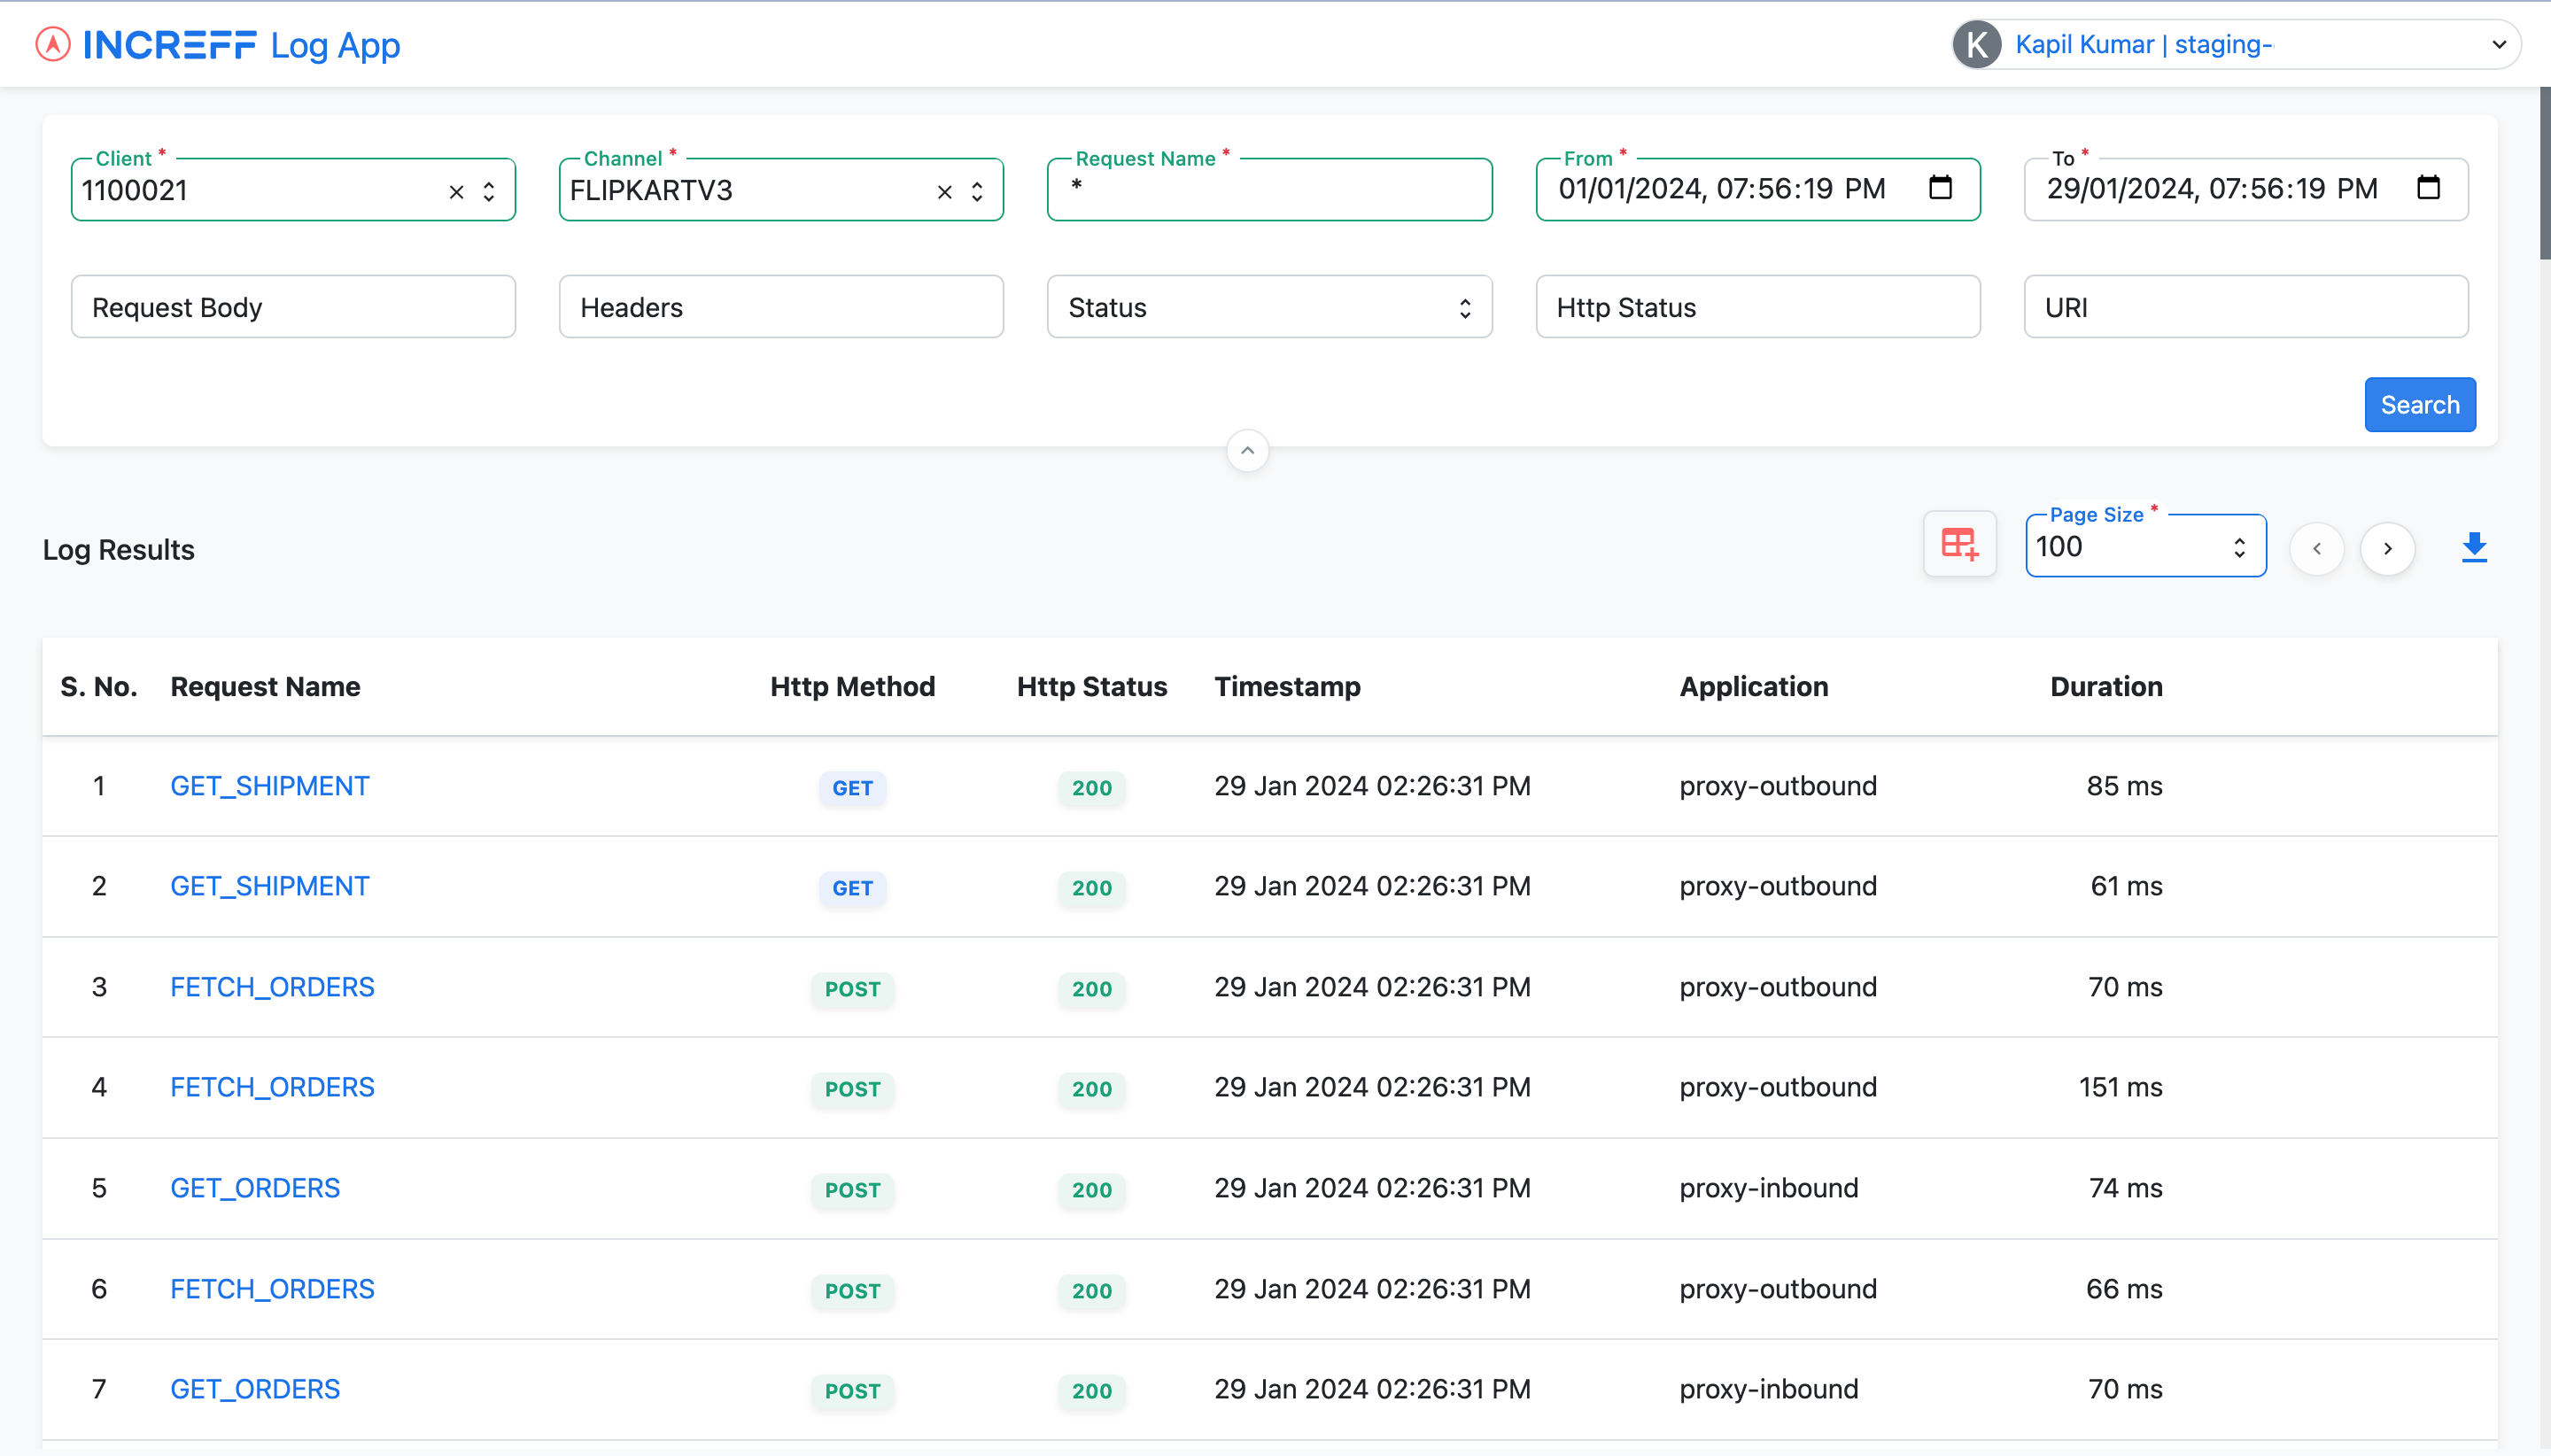
Any of the log results can be expanded on click of the request name.

When the "more" button is clicked, users can expand the request, response, headers, and other related information.
To copy a particular section such as request, response, headers, etc., simply click on the copy button located at the right end of the section.

The sensitive details like phone and email are masked in the logs.
Copy, Download, or Generate a Link for a specific log
The JSON payload containing all fields can be easily copied using the copy button. Additionally, users have the option to download the payload by clicking on the Download button. Furthermore, there is also an option for users to generate a public link for the specific log.

Configure Displayable Columns in Log Search App Results
Click on the Configure Columns button.

Choose the columns to be added. Select All to show all columns in the table
Manage Page Size
Page size represents the number of requests displayed on a page. Users can choose 100, 200, or 500.

In cases where the number of results exceeds the defined page limit, users can employ the left and right arrows to navigate to the next page.

When search results are high and the user wants to scroll to the top, there is a Scroll To Top button on the bottom right corner.
Download All Logs
Click on the Download All Logs button to download all logs. Logs will be downloaded in JSON file on a single page.
