OUTPUT
Introduction
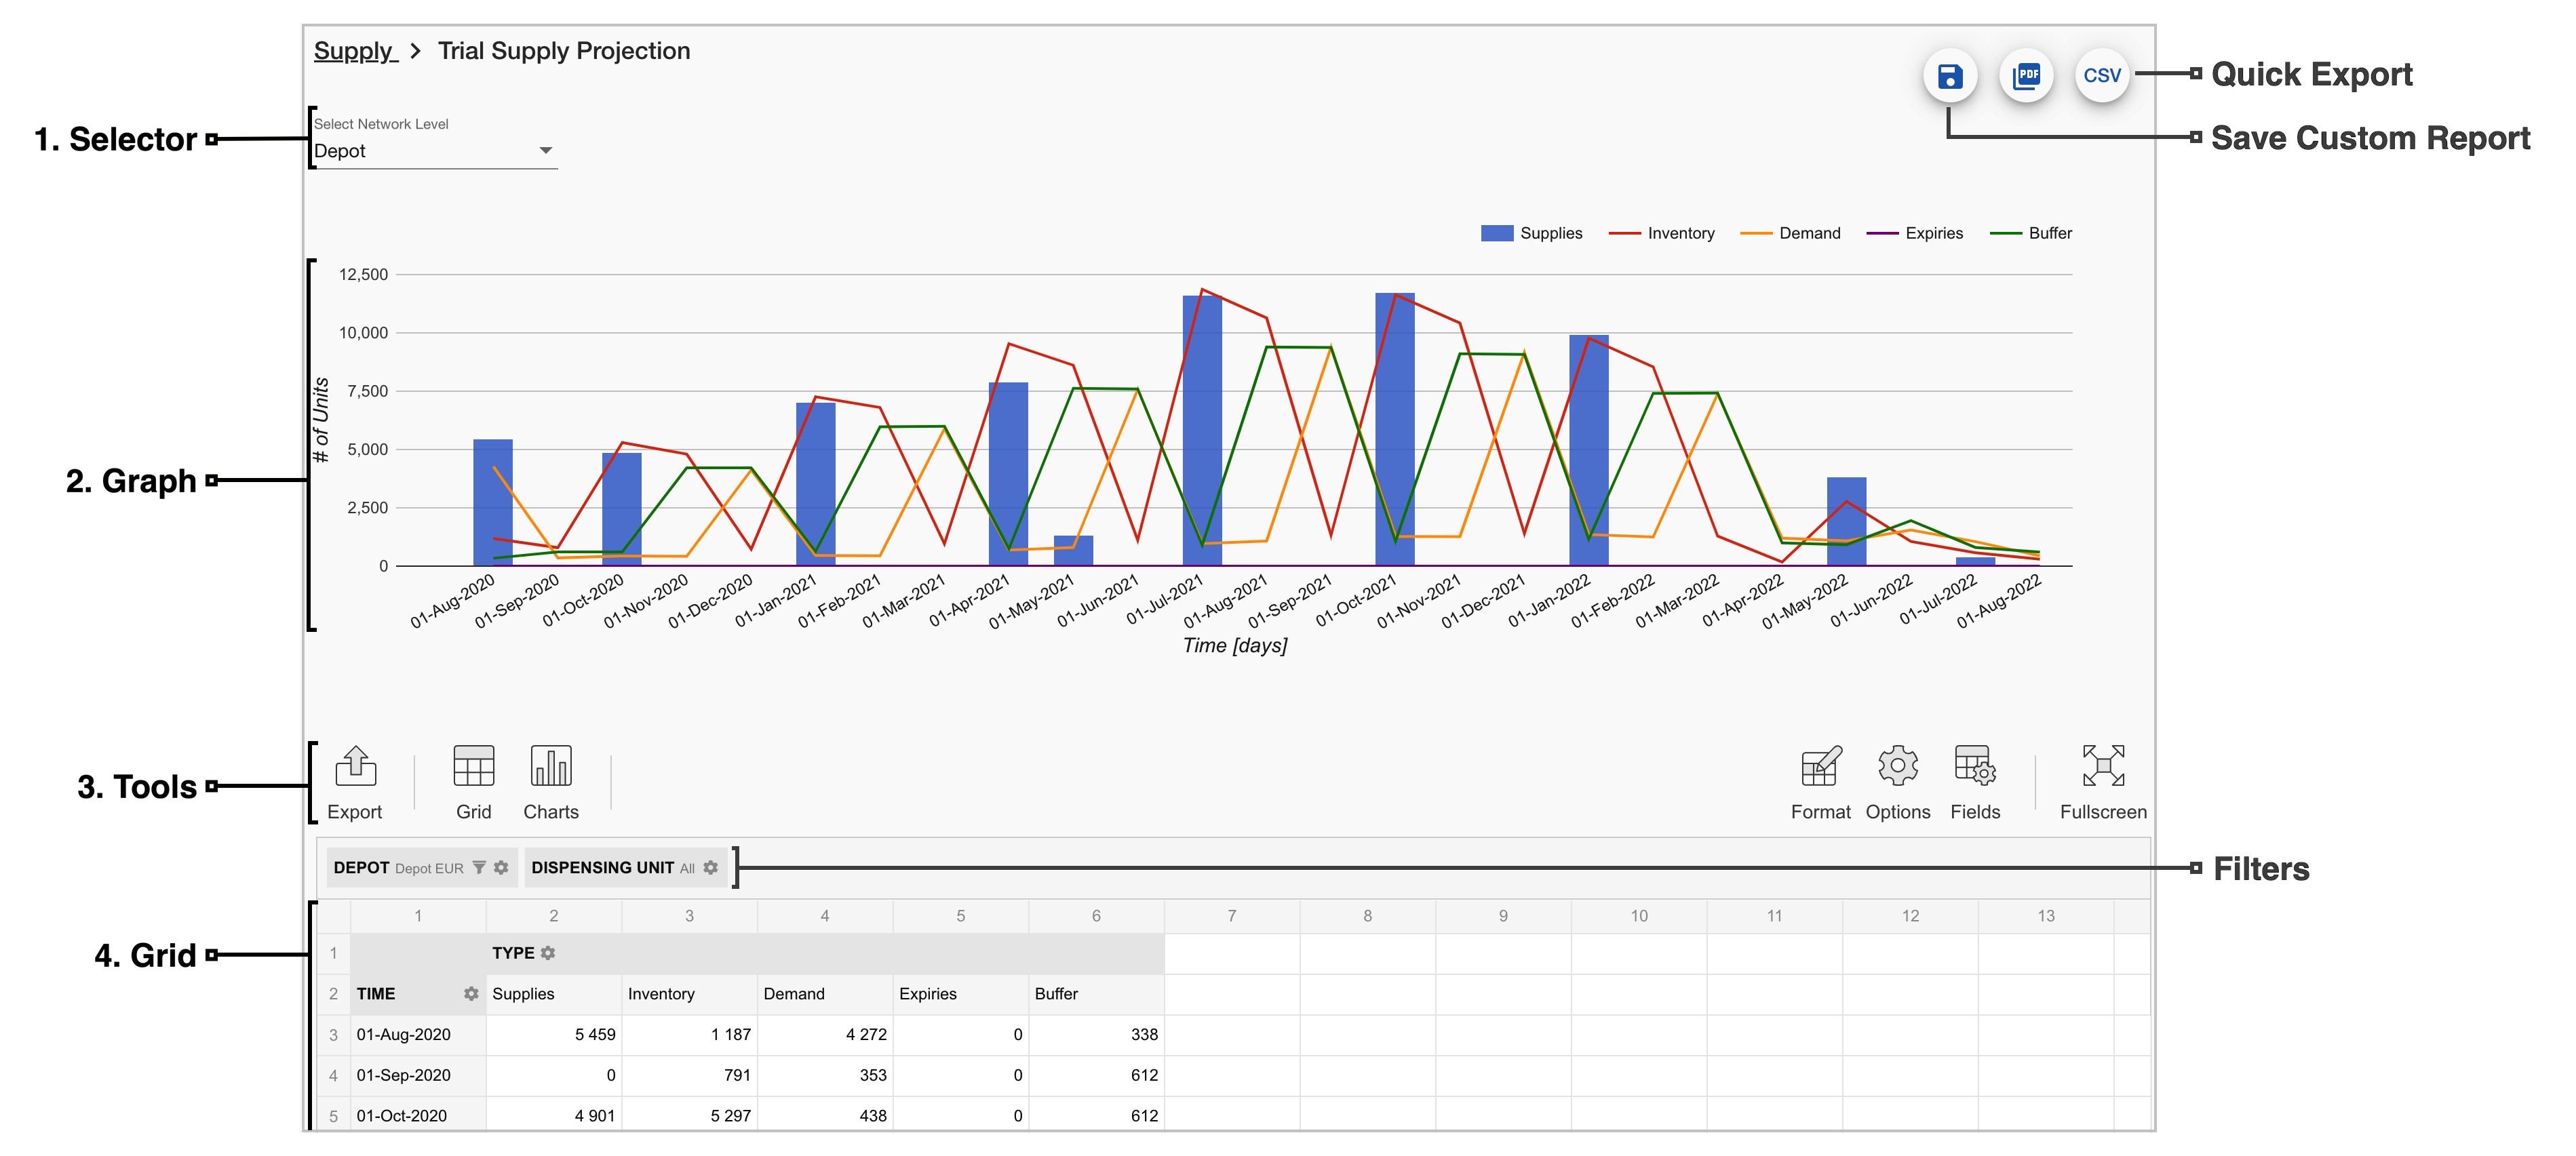
The 4C Supply® output reports allow users to view and analyze the results of forecast calculations. Most of the reports display data in a common format, a graph above a grid. The data reported can be shaped with the selector above the graph and the tools above the grid. There are also a number of export options that allow the data to be downloaded in different file formats.

The elements of standard output reports
Output Report Elements
1. Selector
Selectors (or Network Level selectors) are shown in some reports at the top left of the screen. The selector determines which data level is reported. The report display is refreshed when a different selector item is chosen. Data levels include ‘Depots’, ‘Site Groups’, and ‘Regions’. Only one level can be viewed at a time.
2. Graph
Report graphs are shown above the grid as pre-formatted visual representations of the report data. Report graphs update to match the data selection made in the report grid (i.e., the active filters).
3. Tools
The tools listed below are available in each output report:
Export: Configured report data sets can be exported to different formats via the export button. There are also options for quick export to PDF and CSV to the top right of the graph.
Note that the following reports also feature an option to export non-cumulative data: Site Activation, Patient Enrollment, Patient Net Demand, and Forecasted Network Demand.
Grid: Formats the data from a chart into a grid (see next bullet).
Charts: Formats the data from a grid (default) into a chart. This chart is an optional secondary view that replaces the grid.
Fullscreen: Enables fullscreen view of the report.
Format: Allows for the application of formatting rules, including conditional formatting.
Options: Provides access to toggle between the following display options:
Different ways to show grand totals
Different ways to show subtotals
Different grid forms:
Classic: fields shown as filters, columns, rows, and values
Compact: fields shown as filters, columns, rows, and values
Flat: fields shown as columns and values
Fields: Fields are the parameters shown in the report. Fields can be selected and deselected for display in the popup menu which appears when the Fields icon is clicked. In the same popup menu, fields can be selected for display as filters, columns, rows, or values.
4. Grid
Report grids are shown at the bottom of the screen as a standard data table display of the report data. Report grids are pivot tables and provide many options to shape the report data:
Filters: Data from fields selected for display as filters are not shown in the report. Instead, values can be selected and deselected to filter the data shown in the reports. Fields selected for display as filters can be dragged and dropped into the grid for display as columns or rows.
Columns: Values from fields selected for display as columns are shown as report columns. If multiple fields are selected for display as columns, then their collapse/expand behavior follows the selected hierarchy (left = high). The column hierarchy can be changed by dragging and dropping fields to different positions in the list of columns. Fields selected for display as columns can be dragged and dropped for display as filters or rows.
Rows: Values from fields selected for display as rows are shown as report rows. In many reports, periods of time are shown as rows by default. If multiple fields are selected for display as rows, then their collapse/expand behavior follows the selected hierarchy (top = high). The row hierarchy can be changed by dragging and dropping fields to different positions in the list of rows. Fields selected for display as rows can be dragged and dropped for display as filters or columns.
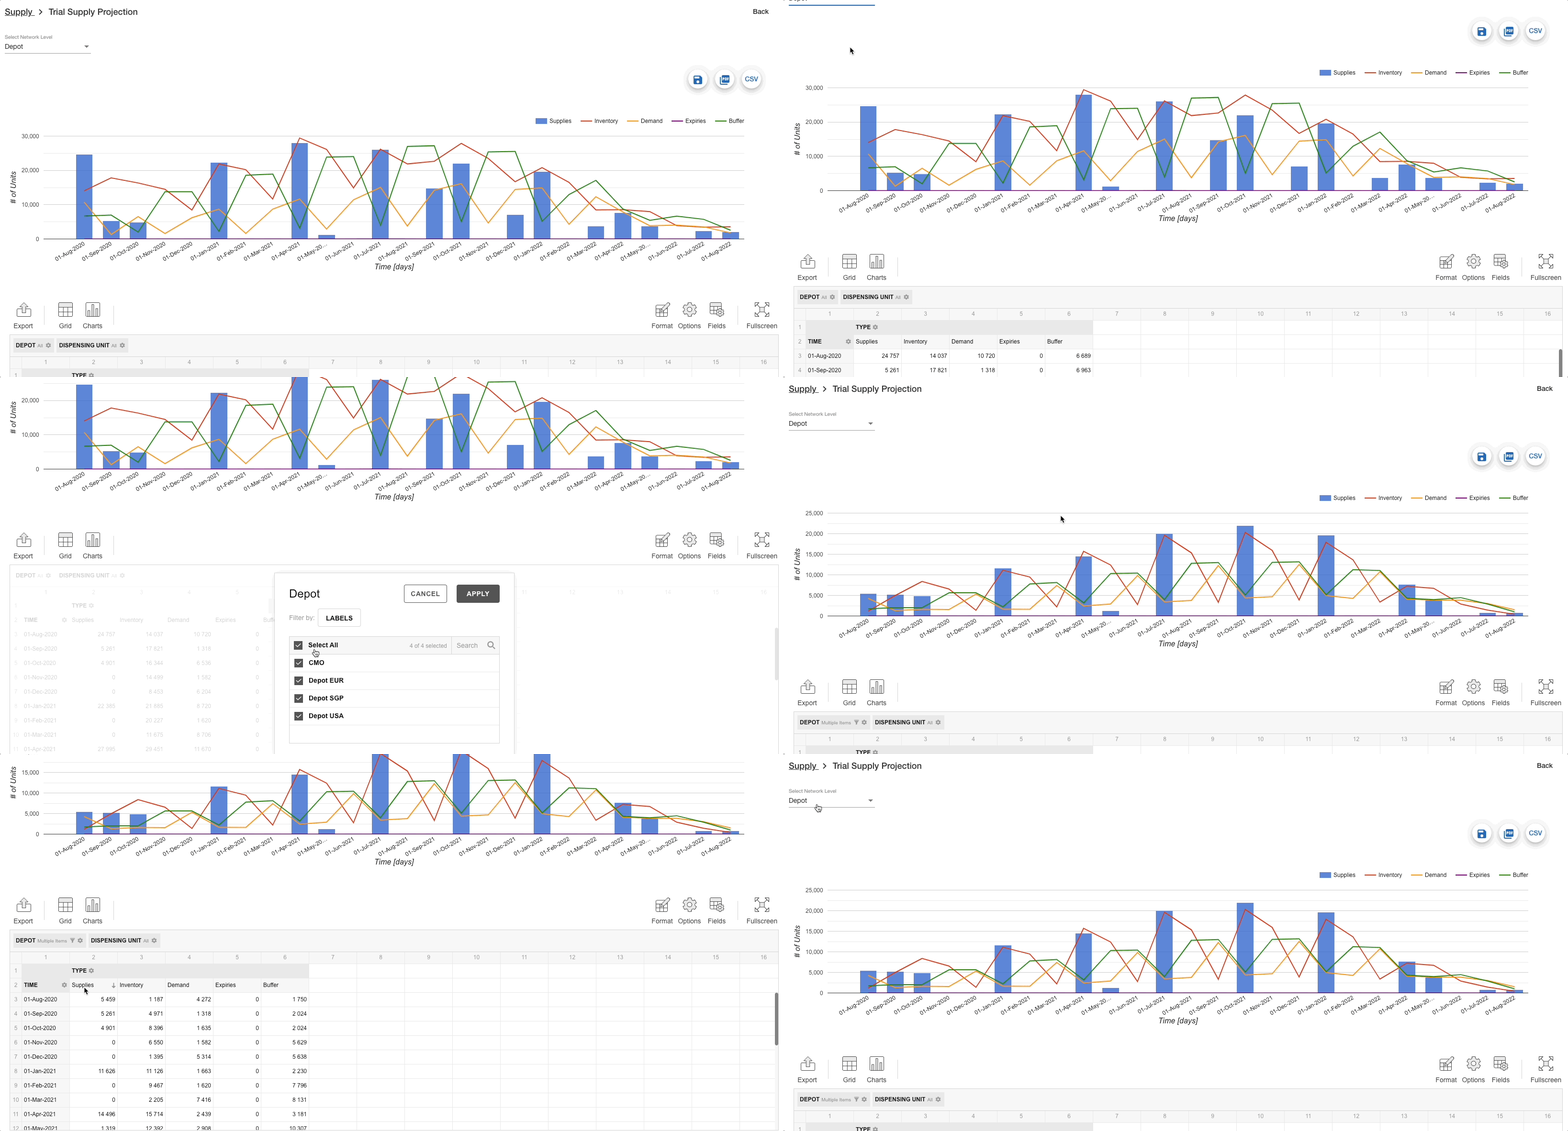
Note: The default report behavior is to display total values and in some instances, this will lead to irrational outputs. For example, the default view of the Trial Supply Projection report displays the combined quantities from all depots including supply depots. This means that the default number reported may appear to be too high but the depot filter can be updated to only include receiving depots to rationalize the outputs (see image below).

Updating a filter to view the required data
Saved Report Settings

The Save Settings option allows users to save report configurations. These saved report configurations are:
User-specific: No other users will see settings that one user saves.
Scenario-specific: The settings will revert if the scenario is re-interpreted. They are not applied to any scenario other than the one where the settings were originally made.
Network level-specific: Settings are only saved at the level they are applied.
Once the data in a report has been configured as required, selecting Save Settings will commit the settings. The next time this report (and network level) us accessed the same settings will be recalled. These changes can be undone by selecting Restore Settings, this option will return the default report view.
Saved Reports

Save custom report configurations with the save icon located at the top right of the report graph. This icon will only appear when a report has been modified in a way that can be saved, i.e., by changing a report field or filter. Changes to formatting cannot be saved. A dialogue will open and the report can be saved under a user-specified name. Saved reports can be accessed from the Saved Reports section of the Navigation Bar or directly from the Reports page. Once a report has been saved, the save icon is replaced by a delete icon, which will erase the saved report.
Save custom report configurations with the save icon located at the top right of the report graph. This icon will only appear when a report has been modified in a way that can be saved, i.e., by changing a report field or filter. Changes to formatting cannot be saved. A dialogue will open and the report can be saved under a user-specified name. Saved reports can be accessed from the Saved Reports section of the Navigation Bar or directly from the Reports page. Once a report has been saved, the save icon is replaced by a delete icon, which will erase the saved report.
Note: Saved reports appear for all users and all forecast reports. All users have the ability to access and delete saved reports.