RTSM Extract Data
Introduction
Once the extract load is complete, all extract data will be displayed in RTSM Extract Data under three tabs, Study Sites, Patient Summary, and Inventory Summary. These three tabs display the extract data that has been loaded, i.e., with mapping applied. This is all of the data that will be considered when running a forecast.
The RTSM Extract Data tab shows the extract data in its ‘raw’ form, i.e., the file as it was transmitted to 4C Supply, without mapping. This tab can be used to review the unaltered data for troubleshooting purposes.
This page can be used to:
Verify that the data in the RTSM data extract matches the corresponding data in the RTSM
Analyze the data in the RTSM data extract
View the data structure in the RTSM data extract
Map actual lots to label groups defined in the specification (Inventory Summary)
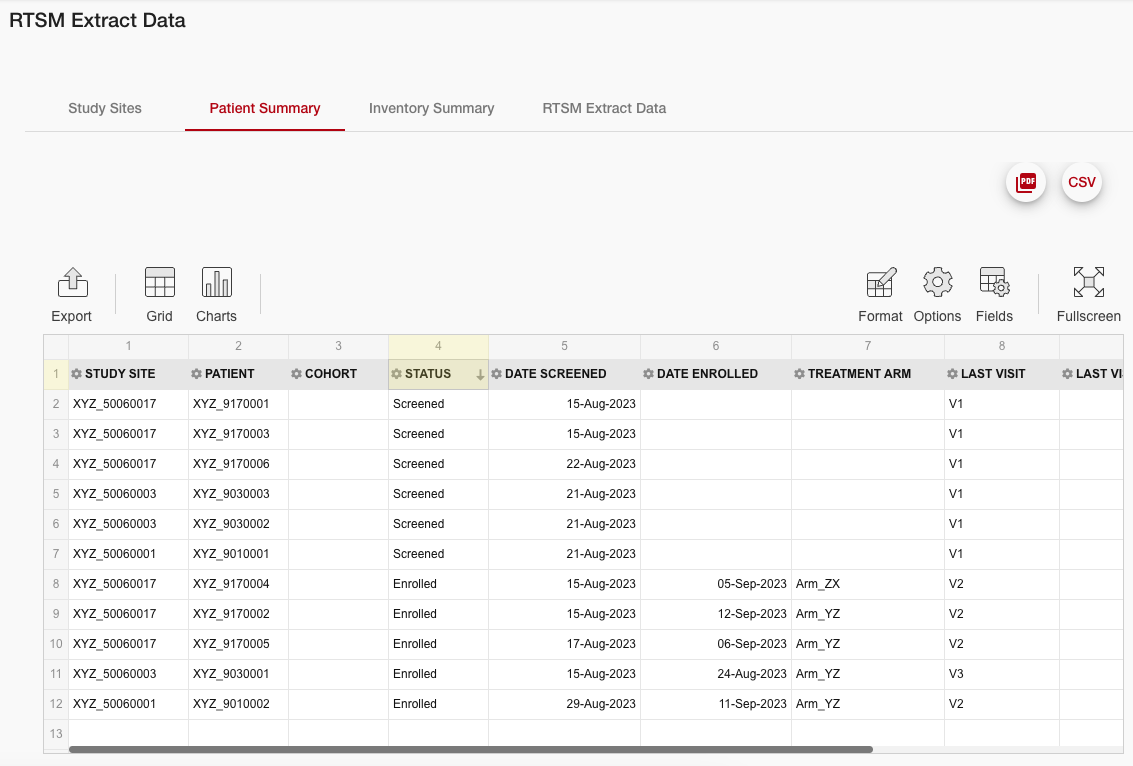
Example of the Patient Summary in RTSM Extract Data
The RTSM extract data input screen displays the actuals data in a context, with the mapping applied.
Study Sites
The study sites tab reports data on actual study sites in the RTSM data extract:
Study Sites: Existing study sites in the RTSM data extract.
Region: Actual region in the RTSM data extract.
Site Activation Date: Actual site activation date in the RTSM data extract.
Enrollment Status: Actual site enrollment status in the RTSM data extract on the RTSM extract date.
Enrollment Group: Actual site enrollment group in the RTSM data extract on the RTSM extract date.
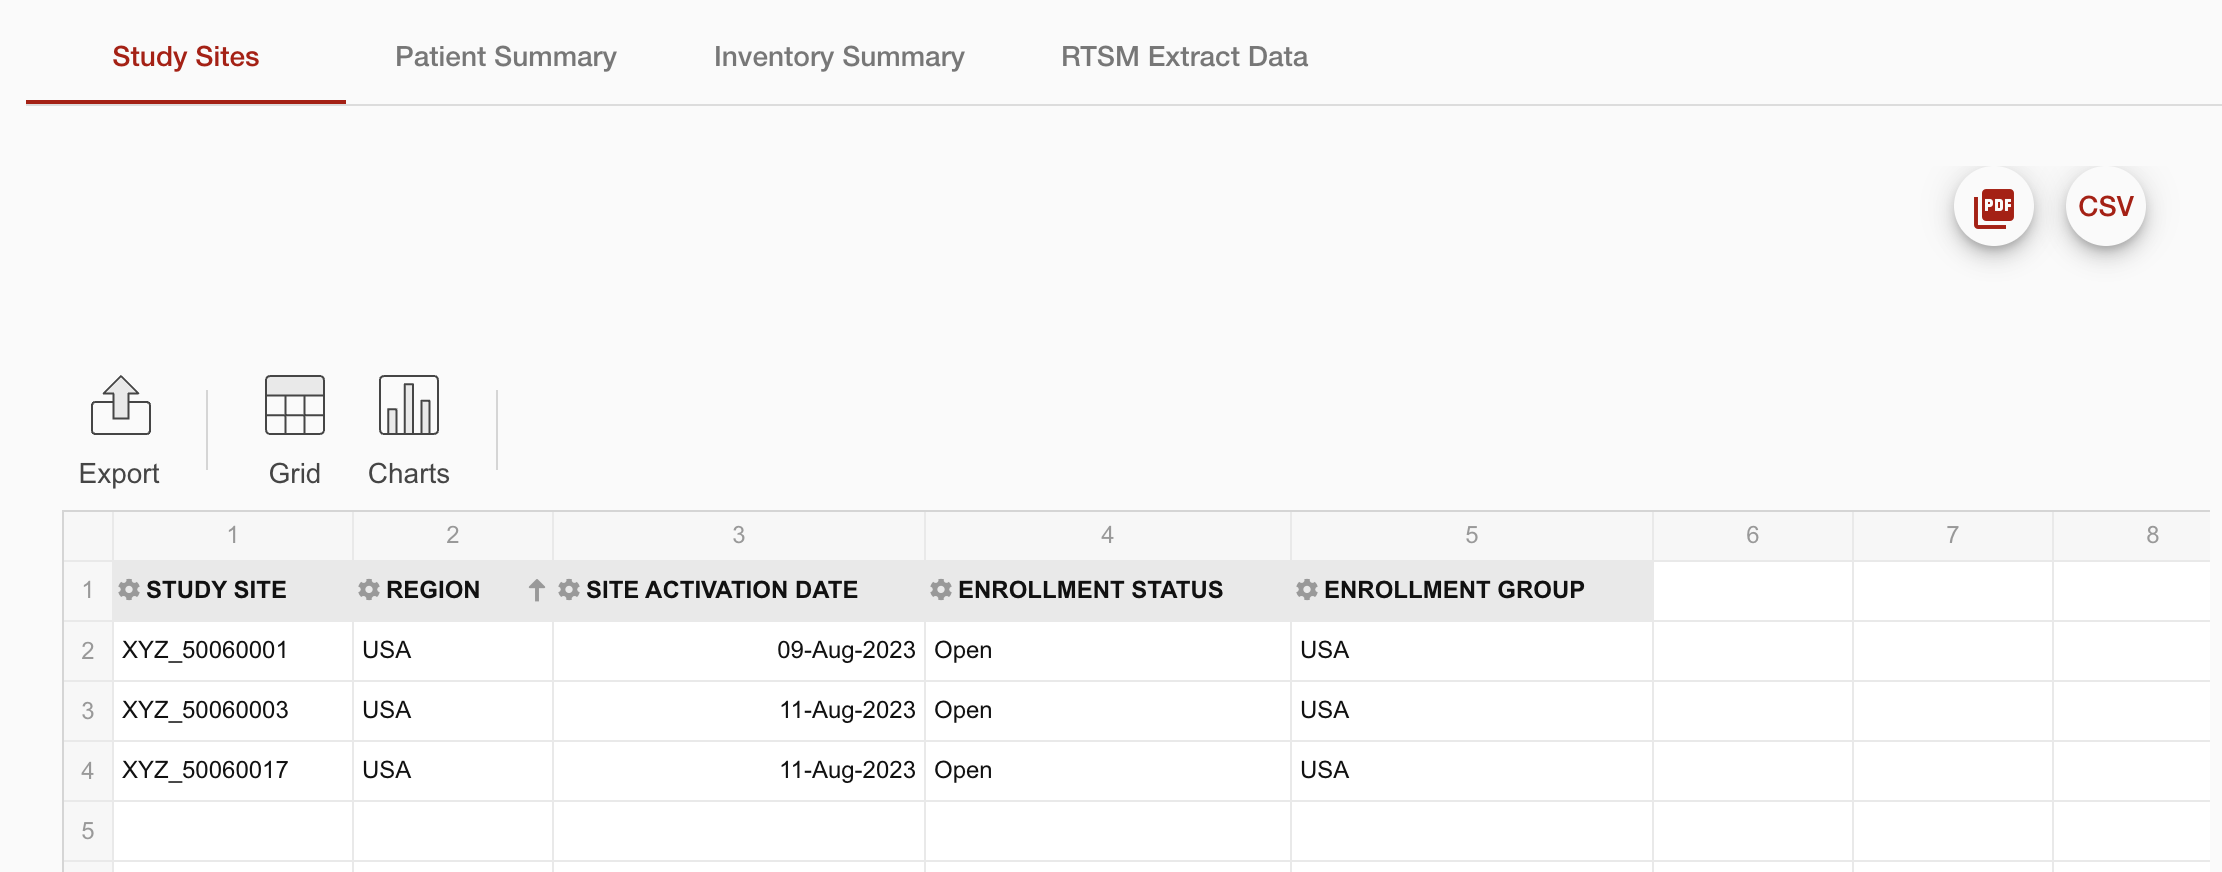
Example study sites tab
Patient Summary
The patient summary tab reports data on actual patients in the RTSM data extract:
Patient: Patient identifier of actual patient in the RTSM data extract.
Cohort: Actual cohort of patients in the RTSM data extract.
Patient Status: Actual patient status in the RTSM data extract on the RTSM extract date.
Date Screened: Screening date of the actual patient in the RTSM data extract.
Date Enrolled: Enrollment or randomization date of the actual patient in the RTSM data extract.
Treatment Arm: The actual treatment arm of the patient in the RTSM data extract.
Last Visit: Identifier of the last visit registered for an actual patient in the RTSM data extract.
Last Visit Date: Date of last scheduled visit registered for an actual patient in the RTSM data extract.
Titration Level At Last Visit: Dose level at the last visit registered for an actual patient in the RTSM data extract.
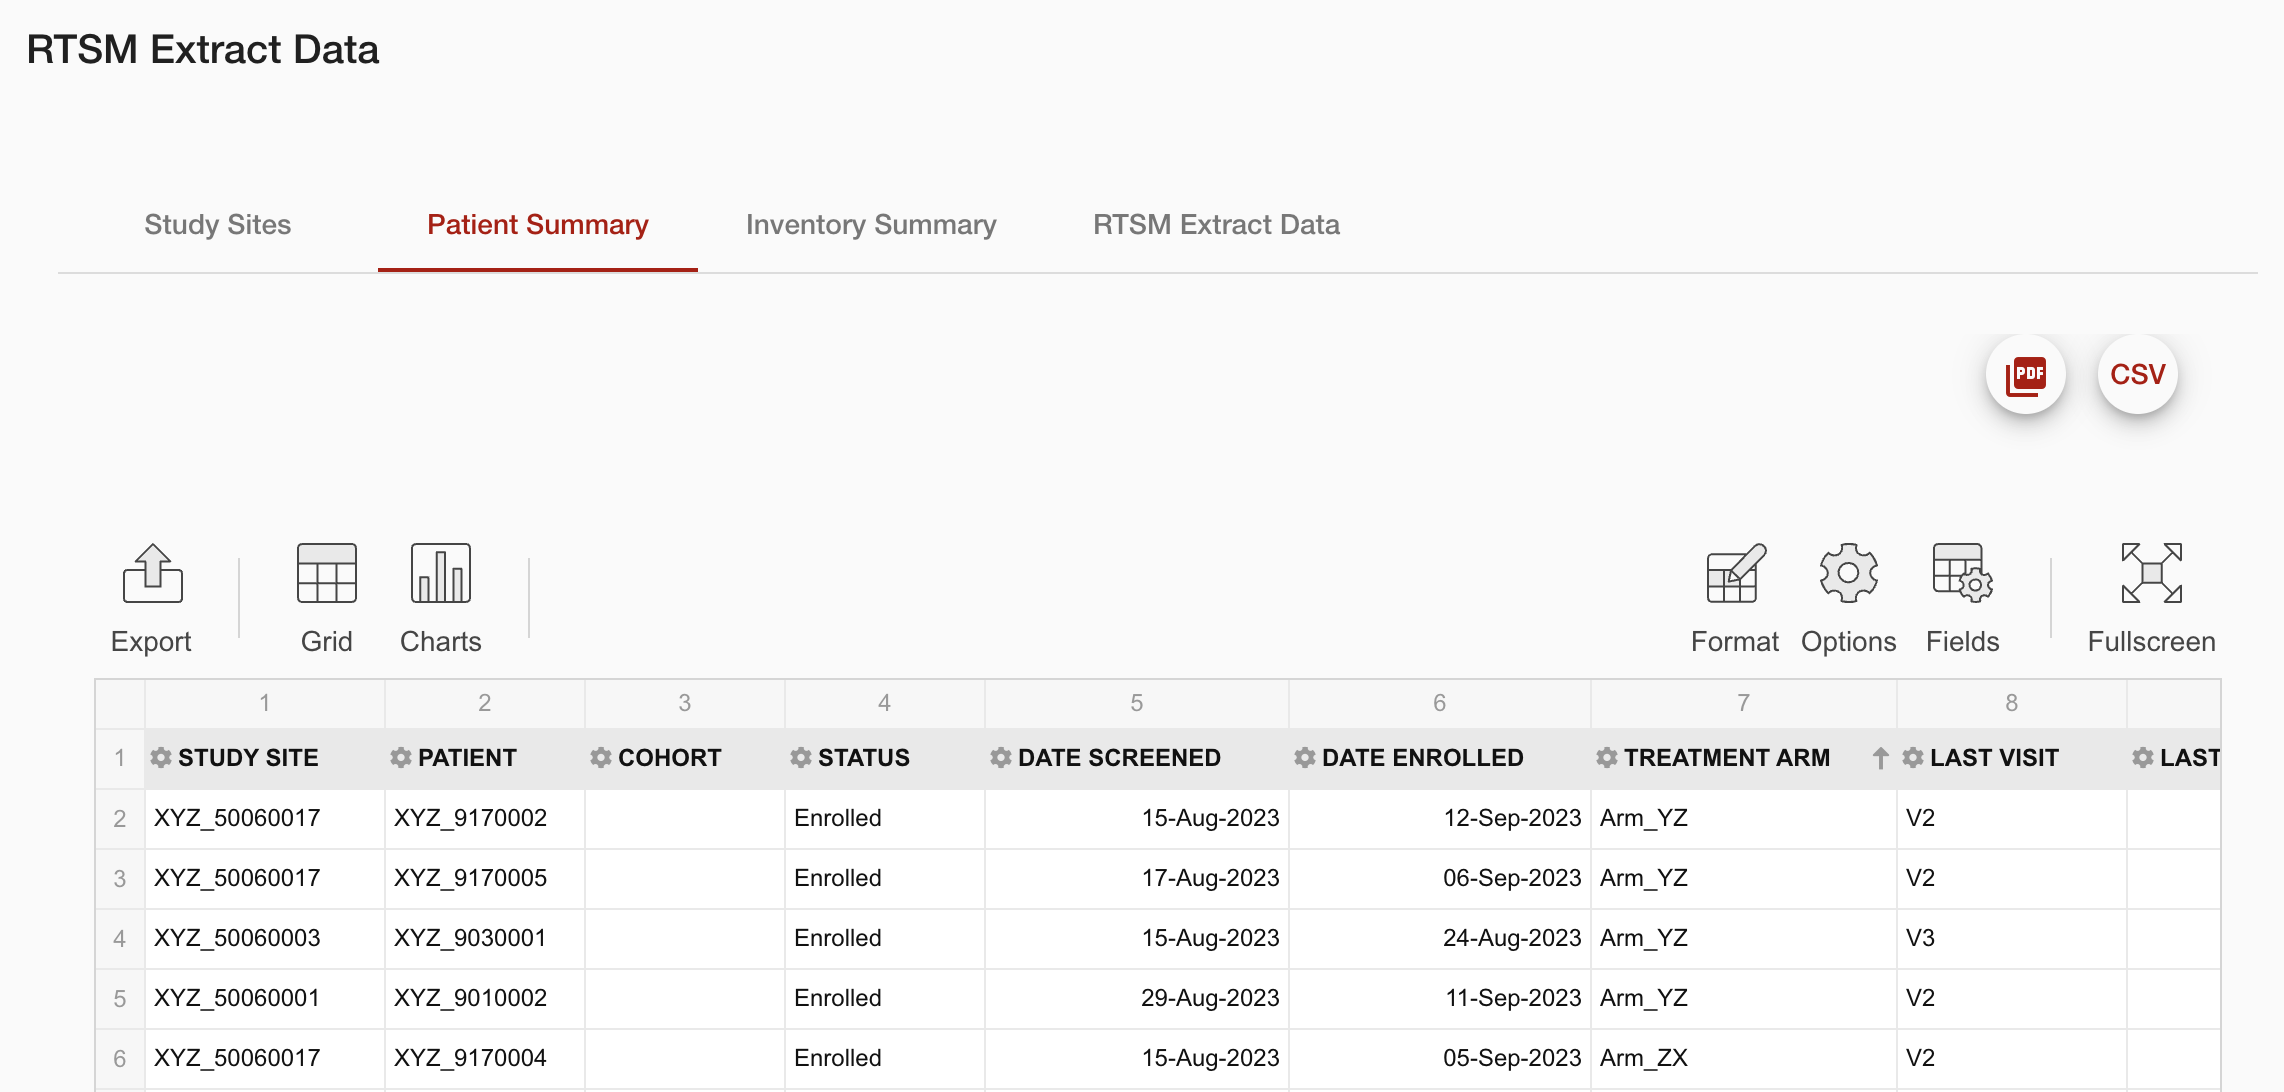
Example patient summary tab
Inventory Summary
The inventory summary tab reports data on actual inventory in the RTSM data extract:
Lot: Identifier of an actual medication batch in the RTSM data extract.
Expiry Date: Expiry date of an actual medication batch in the RTSM data extract.
Kit Type: Kit type of an actual group of kits in the RTSM data extract.
Location: Location (depot or site) of an actual group of kits in the RTSM data extract.
Region: Region associated with the location of an actual group of kits in the RTSM data extract. This is only populated if the location is a site.
Status: Status of an actual group of kits in the RTSM data extract.
Quantity: Quantity of an actual group of kits in the RTSM data extract.
Label Group: Label group assigned to the actual group of kits in the RTSM data extract. This is performed in the table beneath this one, the the next section for more detail.
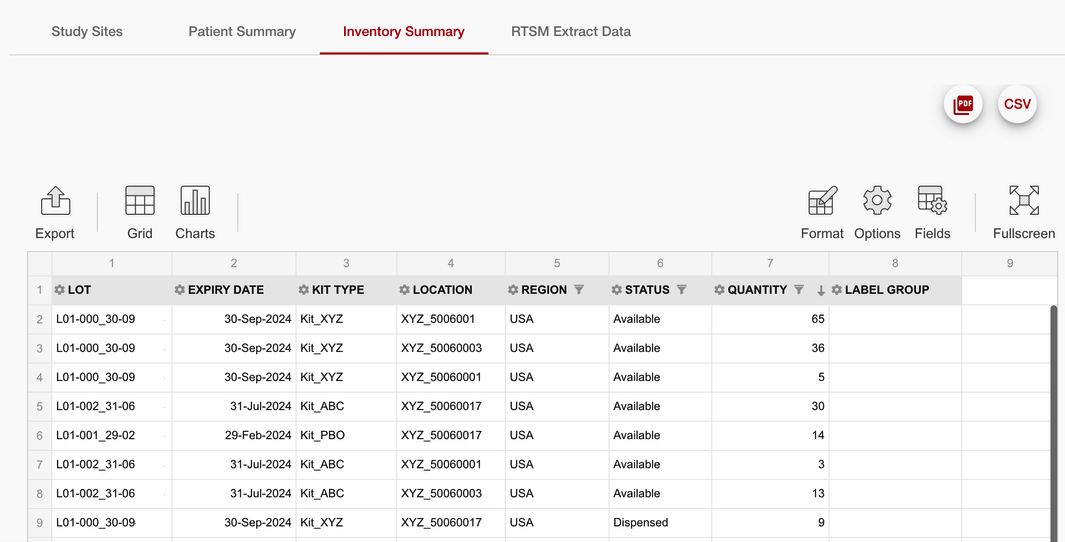
Example inventory summary table
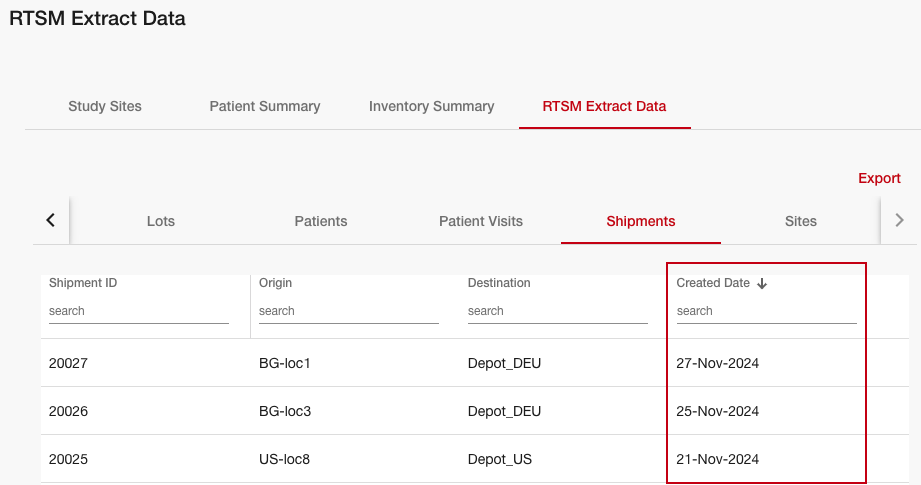
Supplies
Supplies to sites or depots with an 'In Transit' status will display as Supplies in the Trial Supply Projection report and Forecasted Network Supply after the relevant lead time defined:
Supplies will be shown to arrive at their destination on the Shipment’s Created Date + Lead Time.
Except when the result of Created Date + Lead Time is before the date of the actuals extract, then the shipment will display as Supplies the day after the date of the actuals extract.
Note: Return shipments will not be considered as part of the forecast and they will return error messages in the extract log. These error messages do not represent any issue and are intended to highlight that kits returned from sites to depots will not be considered in the forecast.
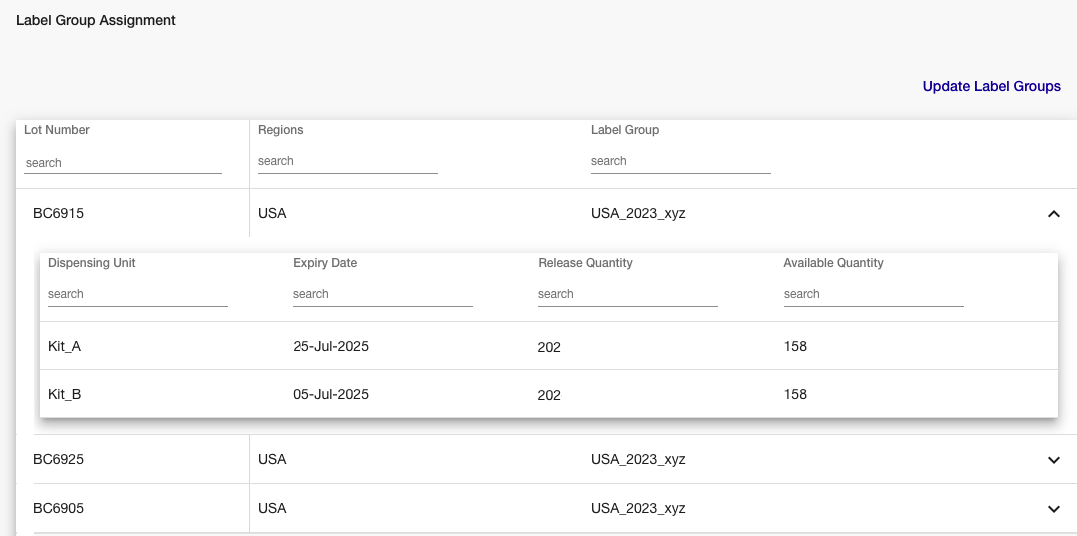
Mapping Lots to Label Groups
Beneath the inventory summary, another table displays lots as they relate to label groups:
Lot Number: Identifier of an actual medication batch in the RTSM data extract.
Regions: Region(s) associated with the location of an actual group of kits in the RTSM data extract.
Label Group: Label group associated with the actual lot. This must be manually completed prior to forecasting.
Clicking on any row will expand that row to display:
Dispensing Unit: Identifier of an actual medication in the RTSM data extract.
Expiry Date: Expiry date of an actual medication batch in the RTSM data extract.
Release Quantity: Released quantity of an actual group of kits in the RTSM data extract.
Available Quantity: Available quantity of an actual group of kits in the RTSM data extract.
When the specification includes label groups, this table can be used to associate actual lots to specification label groups. This is done in the same way as the bulk edits to key mapping.
Note: All lots must be associated with a label group before a forecast can be run. If this is not done, the forecast button will be non-functional and the following message will display:
“Please associate all released lots with a label group first in order to run forecast”
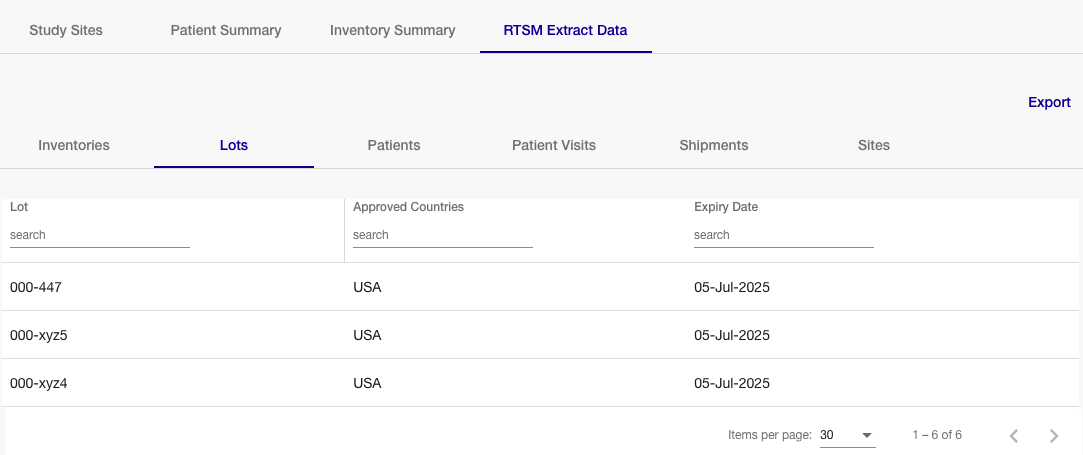
RTSM Extract Data
This table displays the ‘raw’ extract data without mapping applied. The data within this table is sorted into tabs that can be filtered and sorted easily using the headers within each tab. Sorting, filtering, and any other action performed within this view has no impact on the extract data.
There is an Export button that gives users the option to download the extract data either as an Excel or JSON file.
Note: The 'References' (a data category only used for reference within the file) are not displayed on the standard UI but they are detailed in both download formats.
RTSM Extract Data view