Power BI Project App Settings
Connect Data
Below you can find the settings for connecting your data to the Power BI Project App. You must have a Power BI Pro license. To connect your data, you will receive a license key upon payment of your subscription fee. For other information contact support.
Step-by-step instructions
Click on “Connect your data” on the top bar of the report.
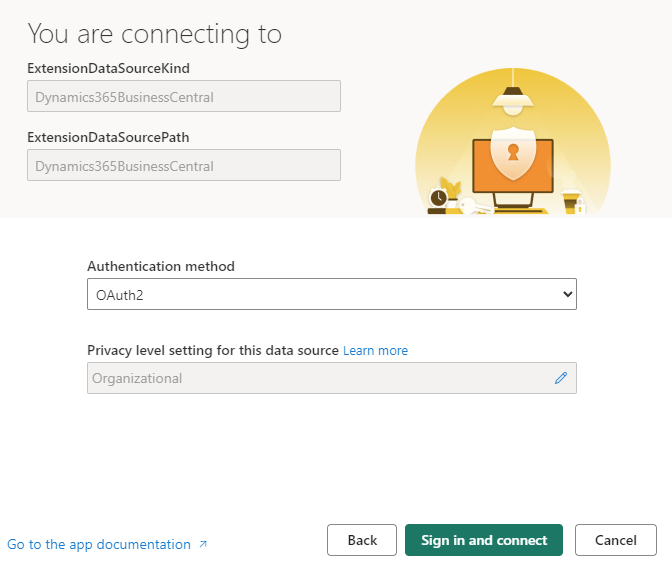
The settings for connecting your Business Central data are displayed, as you can see on the screenshot below.
Fill in the name of the BC Environment.
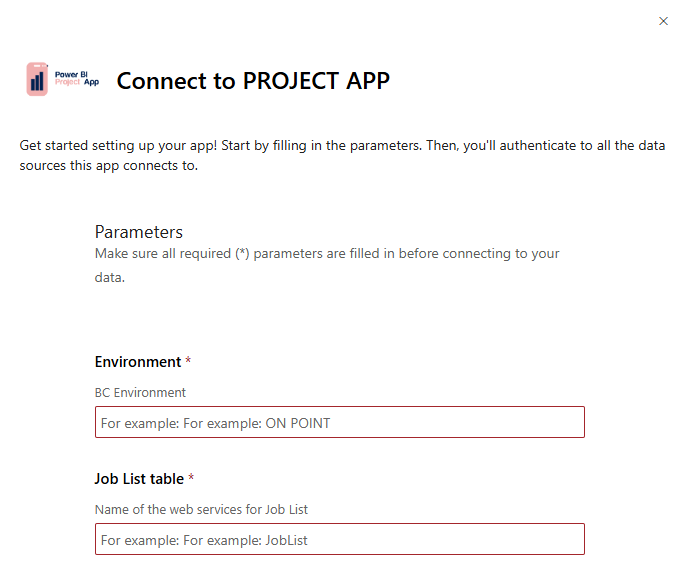
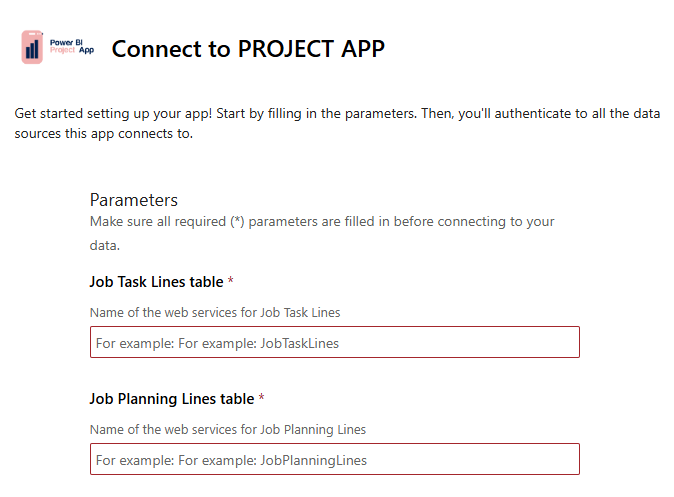
Fill in the names of the web services for the required tables. If you do not know them or have not created them follow these instructions.
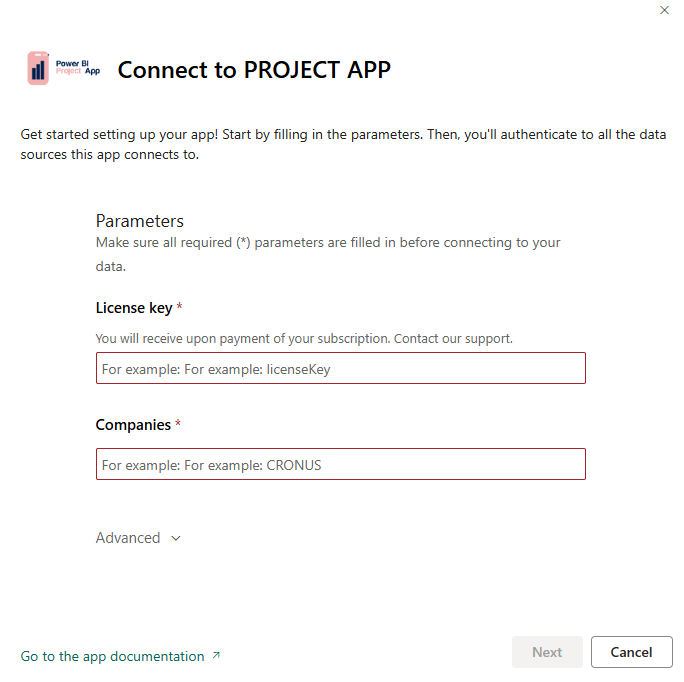
Fill in the license key you received from our support.
Fill in the name of the BC Company.
Click “Next”.
Click “Sign in and connect”.
Sync with your data sources will be in progress (it may take up to 15 minutes).
The App will be automatically refreshed at midnight every day. For the detailed description of the Power BI report click here.
How to create web services in Business Central
If you don't have the appropriate web services published for the report, here's how to do it:
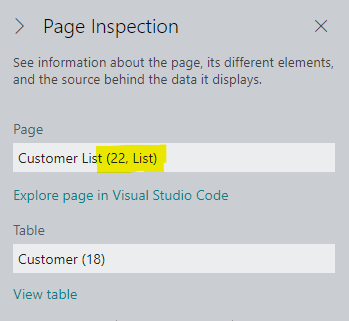
Find out from which page we want to extract data from Business Central.
We need to get the page number with the required data. When you’re on the page, e.g. Customers, use the keyboard shortcut Ctrl + Alt + F1. The Page Inspection tool will open. Copy the number of the page.
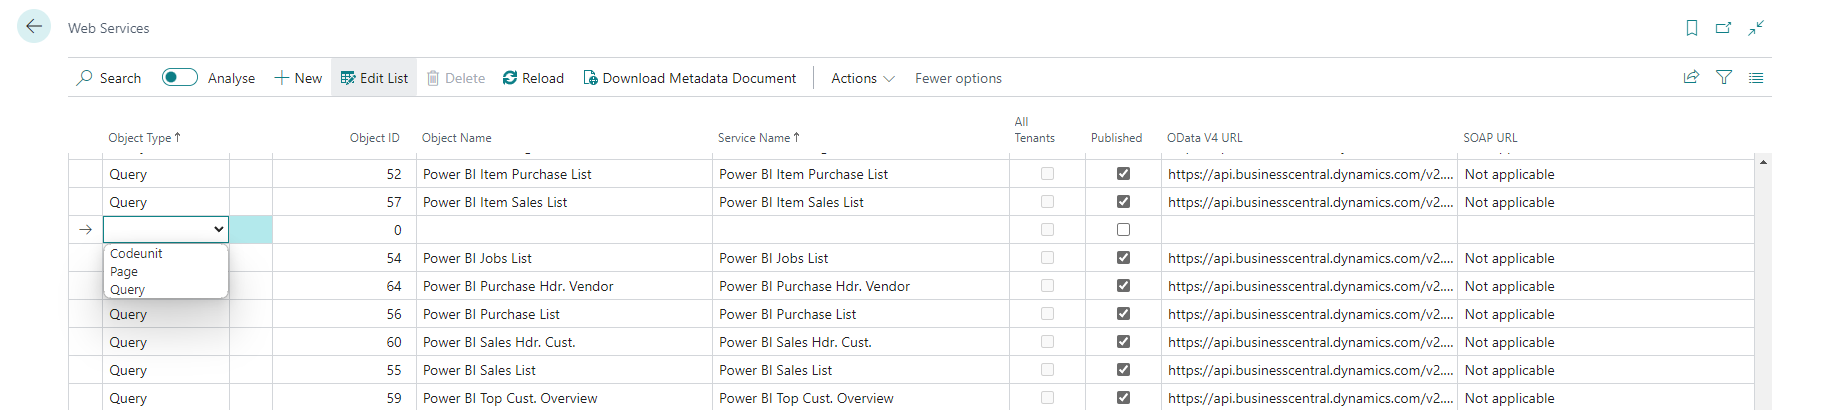
Open "Web Services" using the search window in Business Central.
Edit the list and create new line, then:
select the “Page” Object Type
enter the page number from the step 2 in the Object ID
write the Service Name - you will need to fill this text in the settings for the Power BI Template App.
Check the “Published” checkbox.
Basic information about Power BI report
This document describes a report that focuses on project management. It shows both detailed entries and a graphical representation of the comparison of revenues and costs for each projec Depending on preferences, we can filter the Project Manager, number of project, time period and dimensions. Of course, we can also filter the type and status of project.
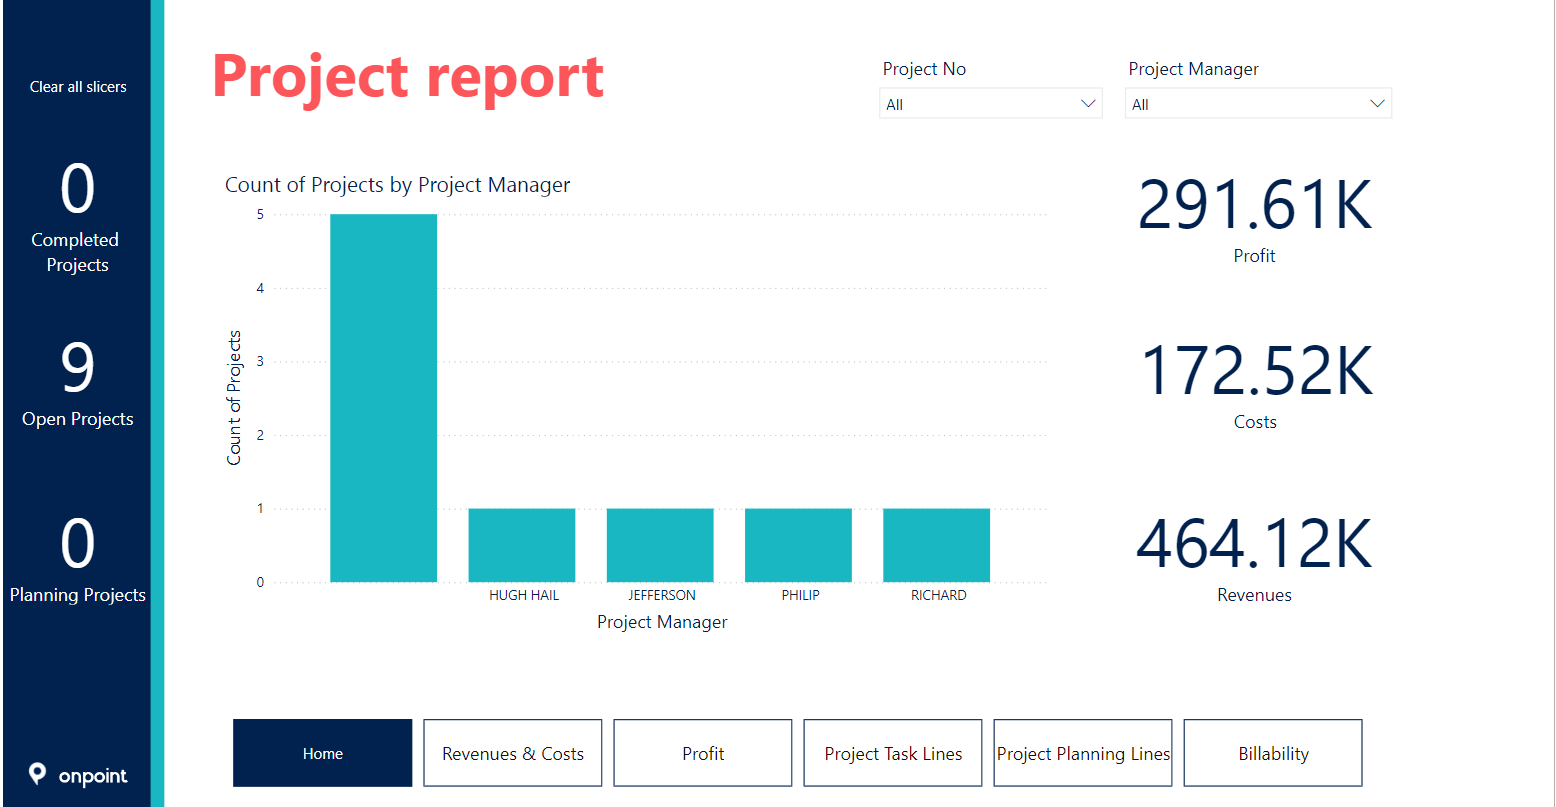
Homepage
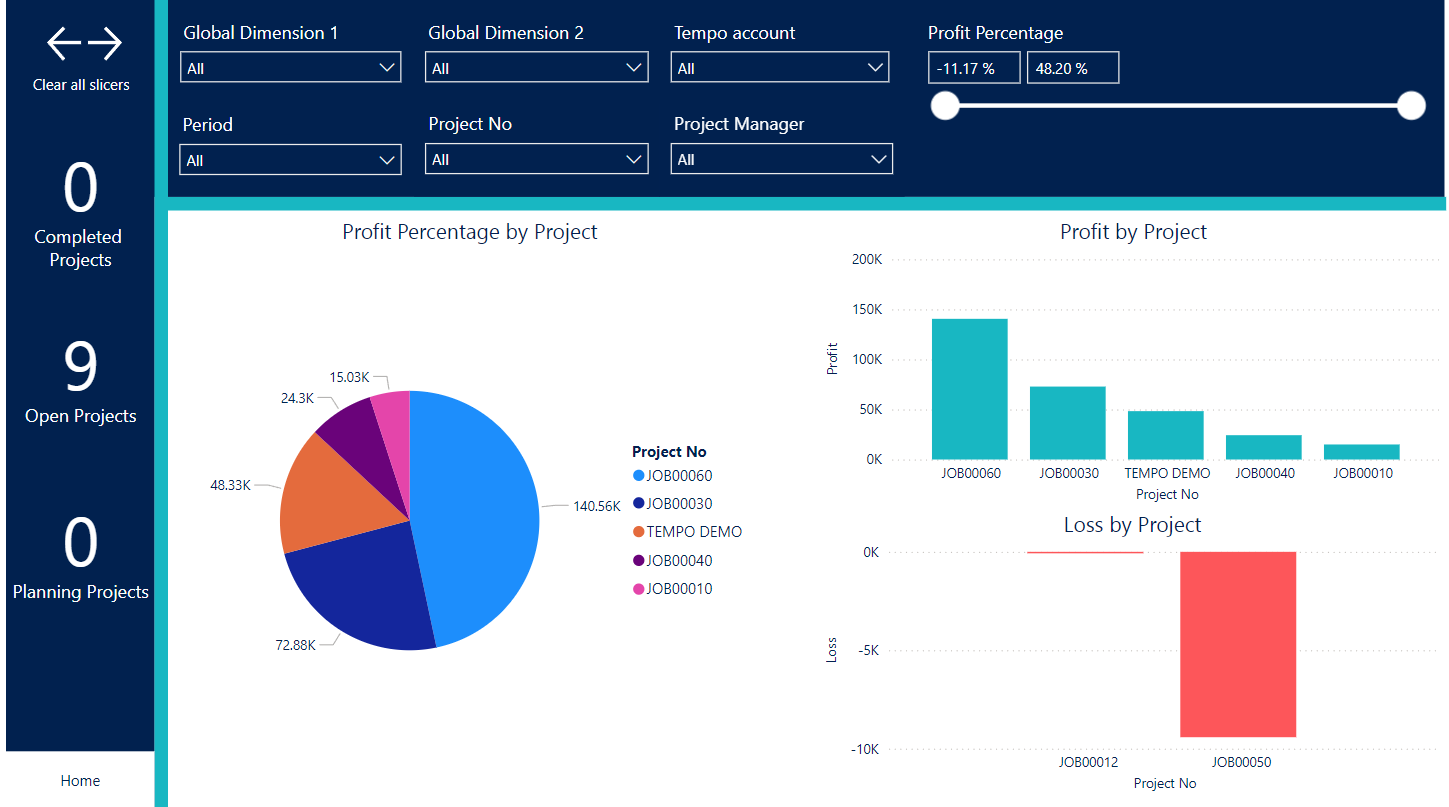
Profit
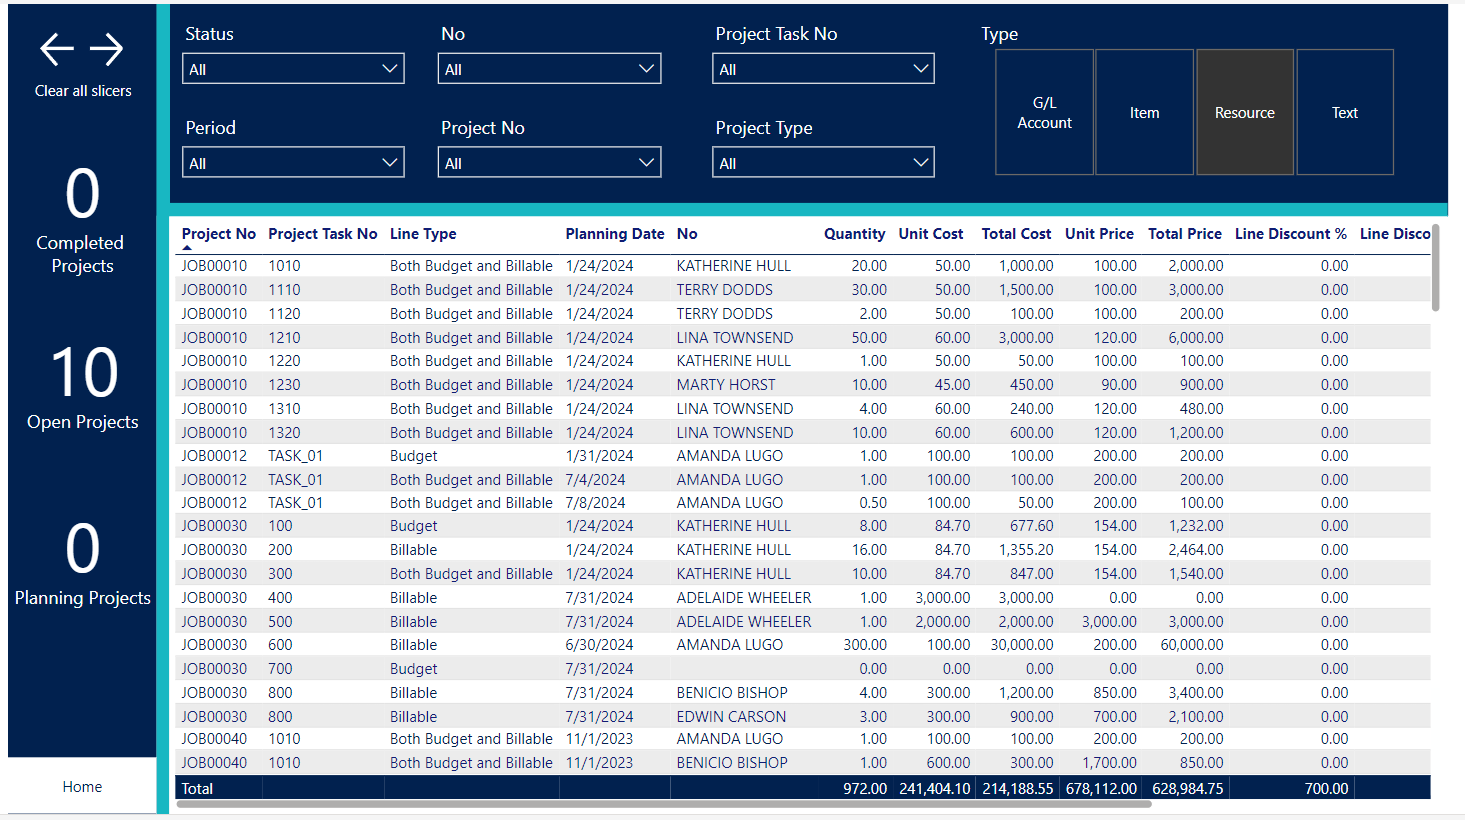
Project Planning Lines
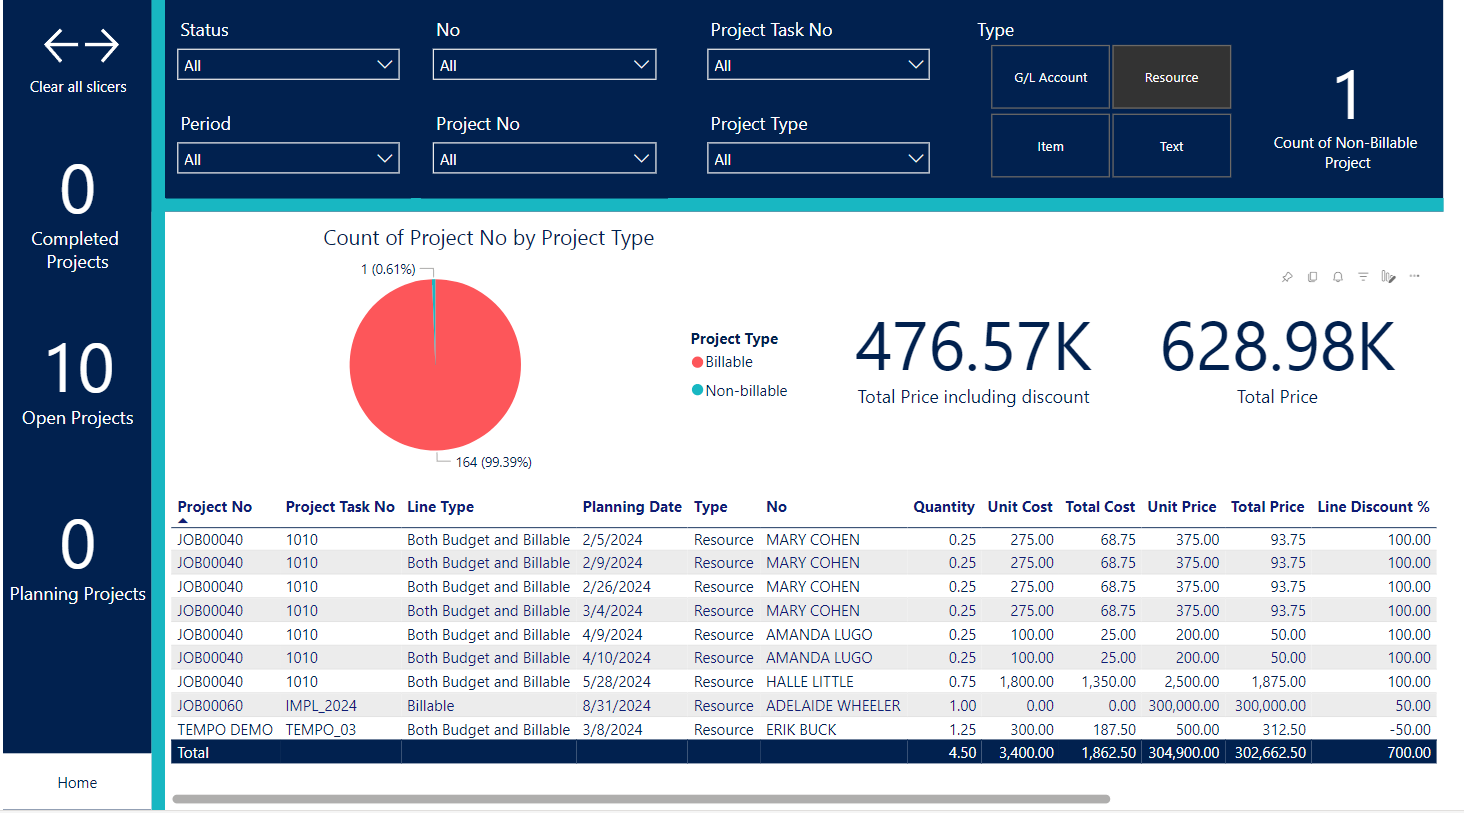
Billability
Default settings
The report is set to display the number of project status and the amount of profit, revenues and costs. The homepage contains a bar chart of the count of projects by manager. For other information, there are several other pages.
How to filter e.g. project number
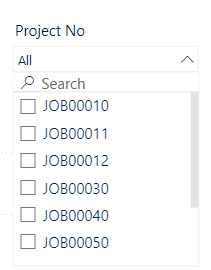
Click on the arrow to see a list of the project number we have. If we want to select only some or only one of the project in the report, we just need to check the box next to the projects. If, on the other hand, we want to see all of them and we have some checked, the easier option is to check "Select all". For more extensive lists, we can use the search box.
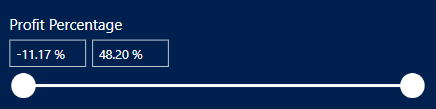
How to change the slicer
By moving the two "wheels" you can change the profit percentage - the number from and the number to.
Manual override using the keyboard.
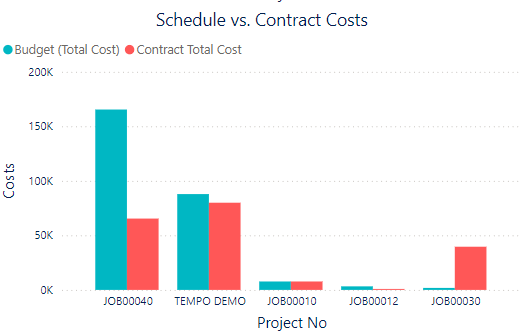
Bar chart: Schedule vs. Contract Costs
This chart graphically displays the costs between schedule and contract costs. By hovering over the desired part in the chart, we can see specific information: the project number and the amount of costs.
Tabs: Project status
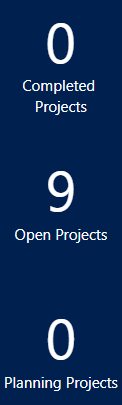
The left tab shows the total number of projects that may be completed, open or planning. This tab is displayed on all pages for clarity.
Button: Delete filters

If we have filtered different views to display the report and we want to see the original view again, just click this button. The report will return to the original state as it was at the beginning.
Table: Job Task Lines
This table shows detailed information about the project task lines. For example, we can see the totaling group, Tempo account, or cost and revenue related to this project task. For better clarity, use the filters above the table.
Page: Billability
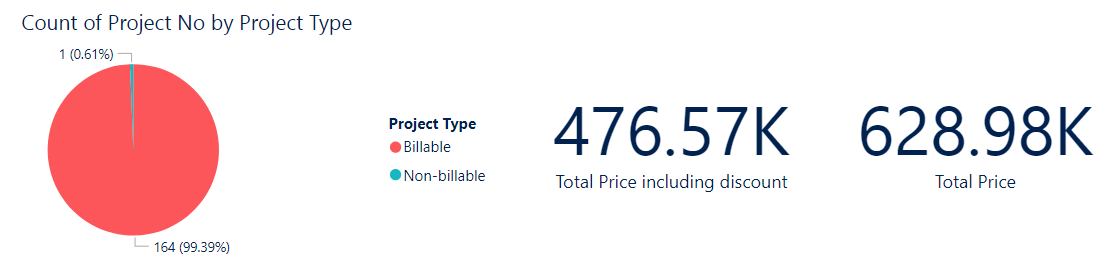
The billability page shows projects that are non-billable and billable. You can also see the total price compared to the possible total price.
Pie chart: Profit Percentage by Project
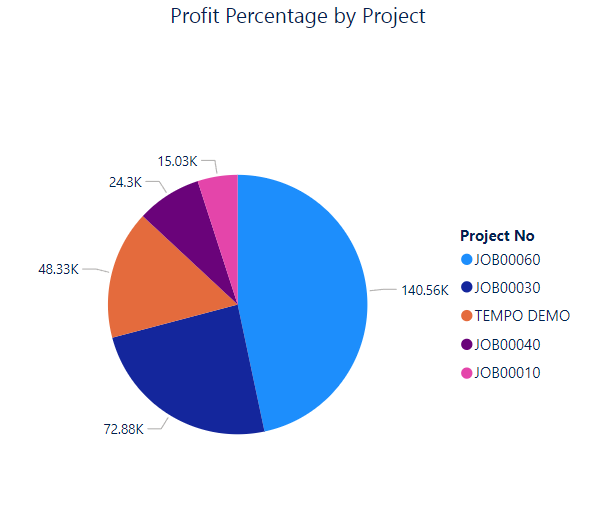
This pie chart shows profit by projects. Using the slicer at the top, we can select which projects have a profit in the range of e.g. 10 to 20 percent.
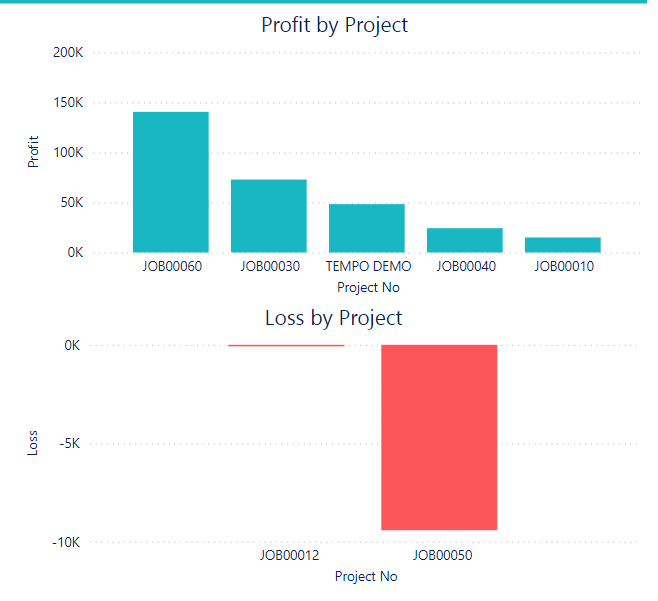
Bar chart: Profit and Loss
These bar charts show both profit and loss by project.