RTSM Comparison Report
Overview
The RTSM Comparison report can be used to compare actual study data from an RTSM extract to the forecast values defined in the specification. In order to populate this report a scenario must be interpreted and an extract must be loaded. A forecast is not required as the report only compares the specification to RTSM extract data.
Site Activation, Patient Enrollment, Screen Fail, and Discontinuation data are all reported, each under a separate tab. Each tab displays a grid with three columns:
Forecast: values/rates as entered in the specification.
Actual: values/rates from an RTSM Extract.
% Difference: a comparison of the two values/rates.
If a Forecast values is 0 and an actual value is greater than 0, the % Difference will always display as 100%.
If a Forecast value is greater than 0 and the actual value is 0, the % Difference will always display as -100%.
Site Activation
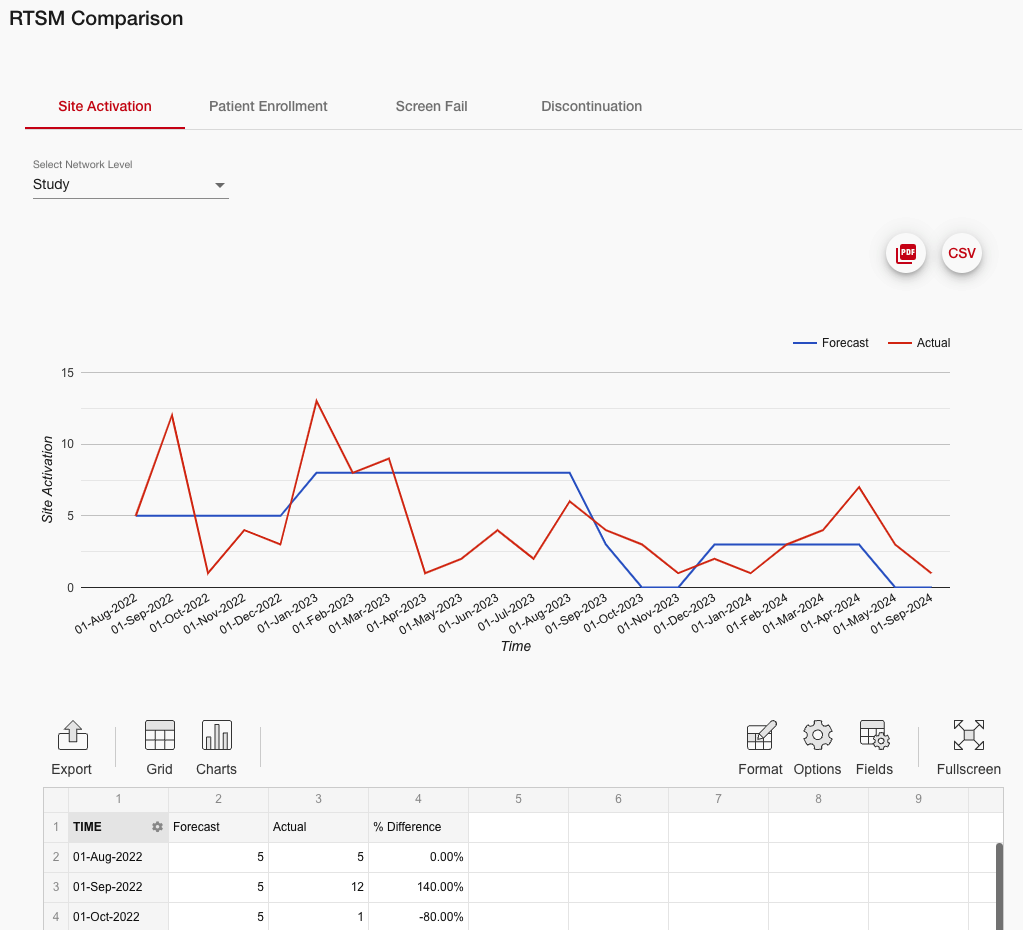
The Site Activation tab in the RTSM Comparison report compares site activations as defined in the specification to the site activations recorded in the RTSM Extract. The network level selector allows the data to be compared in three ways:
Study: Compares total site activations for the study over time.
Region: Compares site activations by region over time. Includes a Region filter that can be used to sort the data in the report by region.
Site Group: Compares site activations by site group over time. Includes a Site Group filter that can be used to sort the data in the report by site group.
Note: If only one site group is defined per region, then the results will be the same between the Region and Site Group Levels.
Example

Patient Enrollment
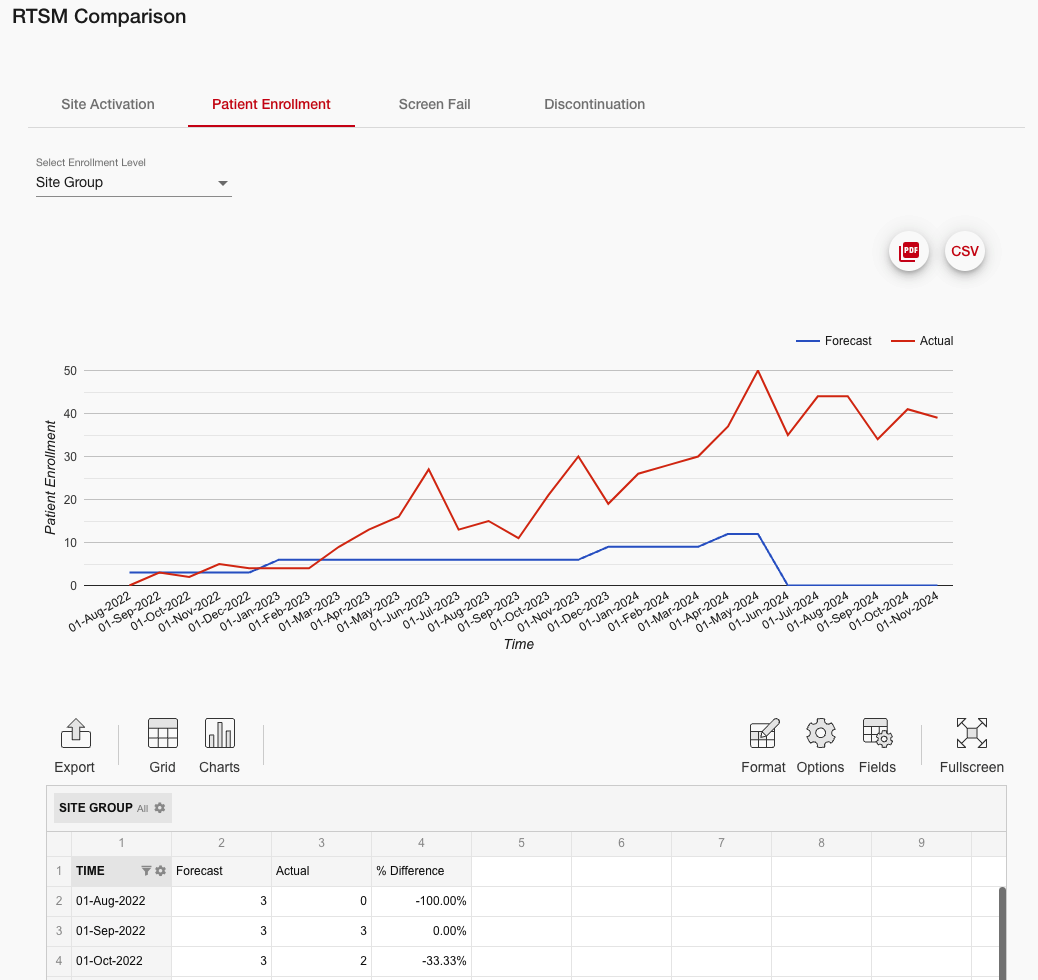
The Patient Enrollment tab in the RTSM Comparison report compares enrollment as defined in the specification to the enrollment recorded in the RTSM Extract. The network level selector allows the data to be compared by region, site group, or cohort to match the enrollment level used in the specification:
Site Group: Compares enrollment by site group over time. Includes a Site Group filter that can be used to sort the data in the report by site group.
Region: Compares enrollment by region over time. Includes a Region filter that can be used to sort the data in the report by region.
Cohort: Compares enrollment by cohort over time. Includes a Cohort filter that can be used to sort the data in the report by cohort.
Note: The report must be viewed at the same enrollment level as is used in the specification in order for data to be correctly displayed. If a specification defines Site level enrollment and this report is viewed at Region level, the Forecast column will display zero enrollment for the entire study.
Example

Screen Fail
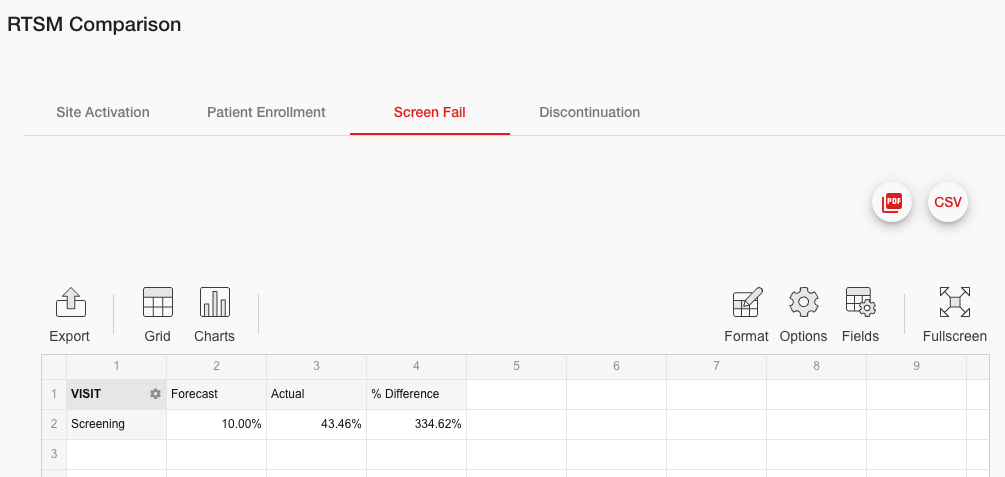
The Screen Fail tab in the RTSM Comparison report compares the screen fail rate as defined in the specification to the screen fail rate derived from the RTSM Extract. If no screen fail rate is defined in the Visit Actions table the Forecast column will display 0 but the Actual column will display screen fail rate calculated from the RTSM extract.
Example

Discontinuation
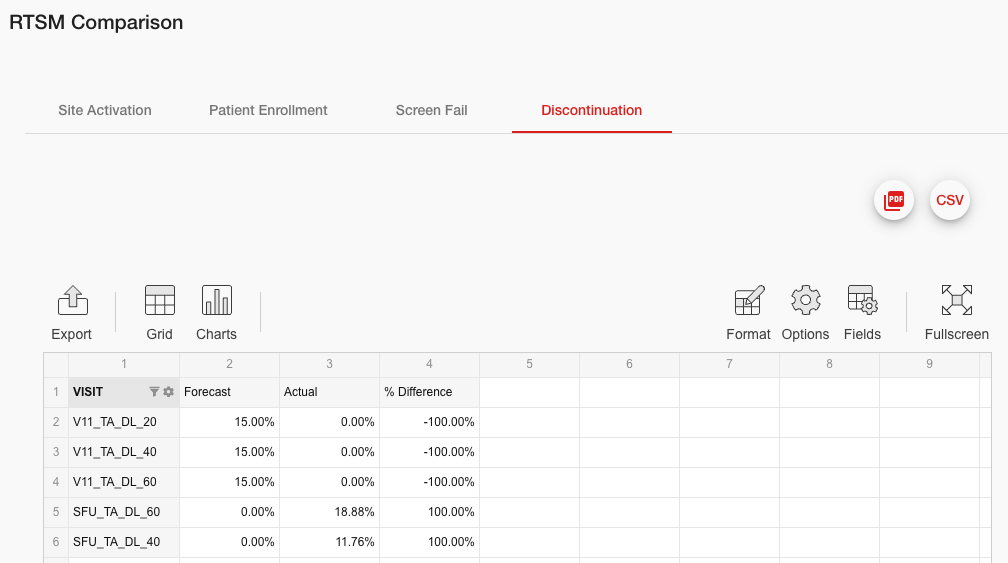
The Discontinuation tab in the RTSM Comparison report compares the discontinuation rate per visit as defined in the specification to the discontinuation rate (per visit) derived from the RTSM Extract. If the specification defines discontinuation rates differently per Cohort, Arm, or Dose Level, then that will be accounted for as well.
If no discontinuation rate is defined in the Visit Actions table the Forecast column will display 0 but the Actual column will display screen fail rate calculated from the RTSM extract.
Example
