Temperature and Pressure Effects
When a brine is put into service, the downhole temperature profile will cause the brine to expand, lowering the average density of the fluid column. Pressure has the opposite effect and causes an increase in density. Adjustments will need to be made to the fluid density to compensate for the combination of bottomhole pressure and bottomhole temperature.
For fluids with densities less than approximately 12.0 lb/gal, thermal expansion will typically be in the range of 0.26 lb/gal to 0.38 lb/gal per 100°F (lb/gal/100°F) increase in temperature. From 12.0 lb/gal to 19.0 lb/gal, the expansion ranges from 0.33 lb/gal to 0.53 lb/gal per 100°F increase. Typically, the density correction is made for the average temperature of the fluid column. Pressure effects are much smaller and range from 0.019 lb/gal per thousand psi to 0.024 lb/gal per thousand psi. Table 2 shows some representative values for thermal expansion (A) and hydrostatic compression (B) based on data reported in literature (Bridges, 2000).
TABLE 2. Corrections for Temperature and Pressure
| Fluid Type | Selected Densities |
Temperature Expansion (A) |
Hydrostatic Compression (B) |
| lb/gal1 | lb/gal/100ºF1 | lb/gal/1000 psi1 | |
| NaCl | 9.0 | 0.314 | 0.0189 |
| NaCl | 9.5 | 0.386 | 0.0188 |
| NaBr | 12.0 | 0.336 | 0.0190 |
| CaCl2 | 9.5 | 0.285 | 0.0188 |
| CaCl2 | 10.0 | 0.289 | 0.0187 |
| CaCl2 | 10.5 | 0.273 | 0.0186 |
| CaCl2 | 11.0 | 0.264 | 0.0187 |
| CaCl2/CaBr2 | 12.0 | 0.325 | 0.0190 |
| CaCl2/CaBr2 | 12.5 | 0.330 | 0.0193 |
| CaCl2/CaBr2 | 13.5 | 0.343 | 0.0201 |
| CaCl2/CaBr2 | 14.5 | 0.362 | 0.0212 |
| CaCl2/Zn-CaBr2 | 15.5 | 0.387 | 0.0226 |
| CaCl2/Zn-CaBr2 | 16.5 | 0.416 | 0.0244 |
| CaCl2/Zn-CaBr2 | 17.5 | 0.453 | 0.0264 |
| CaCl2/Zn-CaBr2 | 18.0 | 0.475 | 0.0276 |
| CaCl2/Zn-CaBr2 | 18.5 | 0.501 | 0.0288 |
| CaCl2/Zn-CaBr2 | 19.0 | 0.528 | 0.0301 |
Values in Table 2 above are adapted from data in Bridges (2000), Completion and Workover Fluids, SPE Monograph 19.
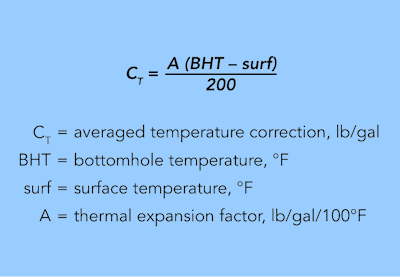
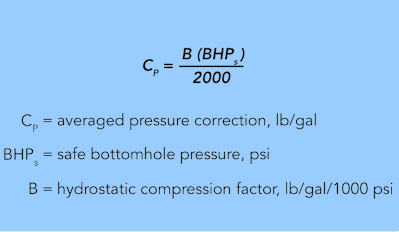
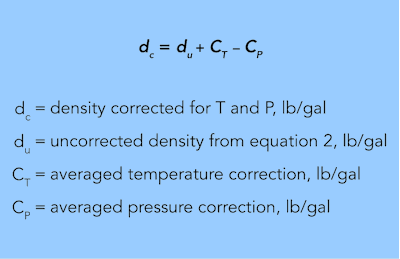
The fluid density corrected for temperature and pressure (dc) is calculated using Equation 5 with input values from Equation 3 and Equation 4 and values for A and B from Table 2.
Temperature Correction
EQUATION 3.

Pressure Correction
EQUATION 4.

The results of Equation 3 and Equation 4 are used in Equation 5 to obtain the corrected density (dc).
Corrected Density
EQUATION 5.

The actual corrected density (dc) of the fluid mixed and delivered to location will be slightly greater than determined, based solely on TVD and BHP in Equation 2.
CBF Temperature and Pressure Profile Software (TP-Pro)
A TETRA fluids specialist is equipped to make a more accurate analysis of the temperature, pressure, and density profile for the entire fluid column. Using TETRA’s TP-Pro™ program, fluids specialists can analyze the temperature and pressure conditions along the entire length of the flow path to ensure that an accurate and reliable prediction of corrected density is made for your particular application.
TETRA’s TP-Pro program calculates the thermal expansion and pressure compressibility behavior of clear brine fluids in a wellbore. The program can be used to model onshore and offshore wells. Solid free brines are especially susceptible to thermal expansion and pressure compressibility, which can significantly alter the effective density of the brine in a downhole application. Because of this susceptibility, a TP-Pro simulation is recommended for every solid free brine application to determine the required surface density of the brine for the necessary effective density.
TABLE 3. TP-Pro Example of Input Variables
TP-Pro Input Variables |
|
| Surface Temperature | 70ºF |
| Mudline Temperature | 39ºF |
| Rig Floor Elevation | 82 feet |
| Water Depth | 3,440 feet |
| Water Depth + Elevation | 3,522 feet |
| Bottomhole Temperaure (BHT) | 275ºF |
| True Vertical Depth of Zone of Interest (TVD) | 17,880 feet |
| Bottomhole Pressure (BHP) | 13,200 psi |
| Overbalance | 250 psi |
| Required Effective Density | 14.47 lb/gal |
| Selected Surface Density | 14.60 lb/gal |
| Pressurized Crystallization Temperature (PCT) | 0ºF |
| Fluid Composition (One, Two, or Three Salt) | One Salt |
| Actual Overbalance | 305 psi |
| Effective Density at 17,880 feet (TVD) | 14.53 lb/gal |
TABLE 4. TP-Pro Example of Output Variables
| Vertical Depth | Actual Density | Effective Density | Temperature | |
| Feet | lb/gal | lb/gal | psi | °F |
| 0 | 14.60 | 14.60 | 0 | 70 |
| 41 | 14.60 | 14.60 | 31 | 70 |
| 82 | 14.60 | 14.60 | 62 | 70 |
| Water Surface | ||||
| 770 | 14.63 | 14.62 | 585 | 64 |
| 1,458 | 14.67 | 14.63 | 1,109 | 58 |
| 2,146 | 14.70 | 14.65 | 1,635 | 51 |
| 2,834 | 14.73 | 14.66 | 2,161 | 45 |
| 3,522 | 14.76 | 14.68 | 2,689 | 39 |
| Mudline | ||||
| 4,240 | 14.74 | 14.69 | 3,239 | 51 |
| 4,958 | 14.71 | 14.70 | 3,789 | 63 |
| 5,676 | 14.68 | 14.70 | 4,337 | 74 |
| 6,394 | 14.65 | 14.69 | 4,885 | 86 |
| 7,112 | 14.63 | 14.69 | 5,431 | 98 |
| 7,829 | 14.60 | 14.68 | 5,977 | 110 |
| 8,547 | 14.57 | 14.67 | 6,521 | 122 |
| 9,265 | 14.54 | 14.66 | 7,065 | 133 |
| 9,983 | 14.52 | 14.65 | 7,607 | 145 |
| 10,701 | 14.49 | 14.64 | 8,148 | 157 |
| 11,419 | 14.46 | 14.63 | 8,689 | 169 |
| 12,137 | 14.43 | 14.62 | 9,228 | 181 |
| 12,855 | 14.40 | 14.61 | 9,766 | 192 |
| 13,573 | 14.38 | 14.60 | 10,304 | 204 |
| 14,291 | 14.35 | 14.59 | 10,840 | 216 |
| 15,008 | 14.32 | 14.57 | 11,375 | 228 |
| 15,726 | 14.29 | 14.56 | 11,909 | 240 |
| 16,444 | 14.27 | 14.55 | 12,442 | 251 |
| 17,162 | 14.24 | 14.54 | 12,974 | 263 |
| 17,880 | 14.21 | 14.53 | 13,505 | 275 |
The results of a TP-Pro simulation are based on best available information and assume equilibrium and static well conditions.