Forecasted Inventory
Introduction
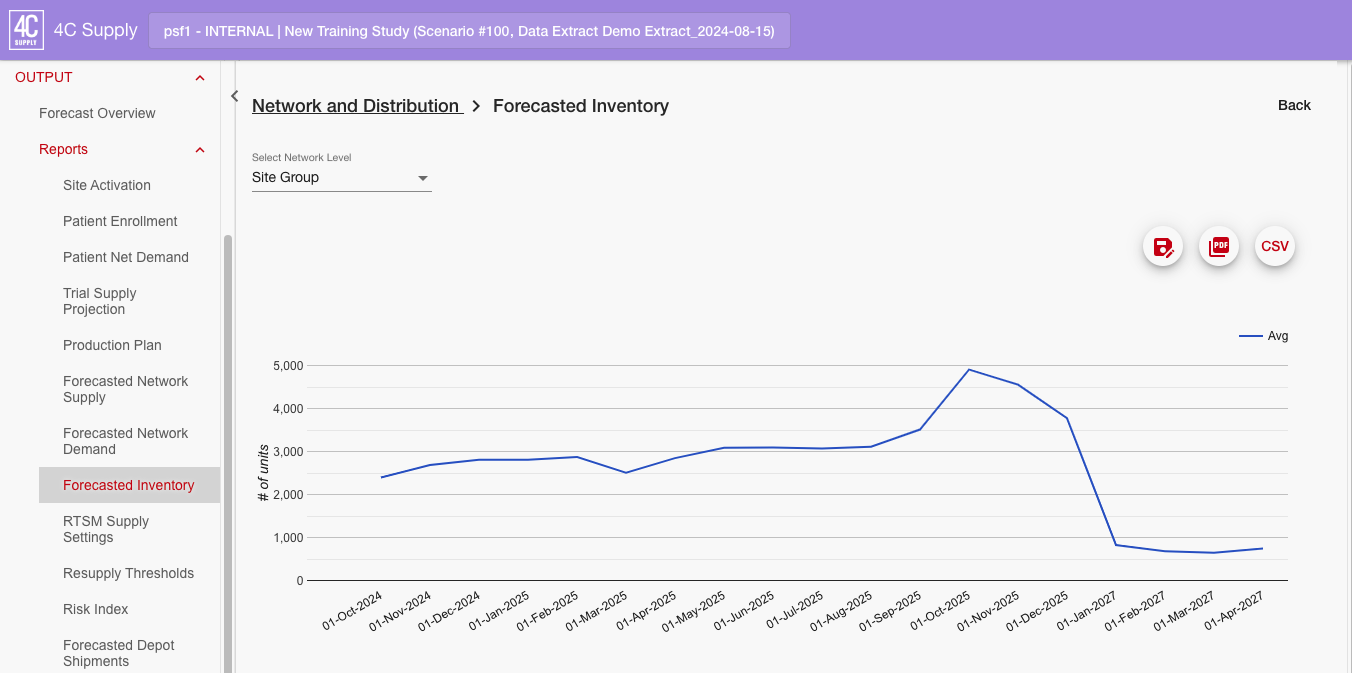
The forecasted inventory report shows forecasted dispensing unit quantities available at a given location over time. Forecasted inventory values are will equal the inventory from the Trial Supply Projection report (without rounding). The report data can be shown for different network levels, determined by the report selector (i.e., the Select Network level dropdown).
Example
Report Selectors
Depot: Shows the forecasted inventory quantities available at depots over time.
Site Group: Shows the forecasted inventory quantities available at site groups over time.
Actual Site: Shows the forecasted site inventory available at actual sites over time (only available when an RTSM extract has been used).
Average Site: Shows the forecasted inventory quantities available at an average site overt time.
Note: By default, the depot and site group data appears stacked. Applying a filter may be necessary to rationalize the data.
Fields and Filters
Depot
Determines for which depot(s) data is shown in the report.
Only shown when depot is selected as the network level.
Dispensing Unit
Defines the dispensing unit(s) for which inventory quantities are shown. By default, stacked data for all dispensing units are shown in the report. Therefore, it often makes sense to filter for a specific dispensing unit.
# of Packs
If Pack Size is defined in the Dispensing Units table, the # of Packs will be detailed in multiples of the defined pack size. This filter is only visible at the Production Facility and Depot levels.
If no pack size is defined, it a default value of 1 is applied and # of Packs = # of Units
Site Group
Determines for which site group(s) data is shown in the report.
Only shown when average site or site group is selected as the network level.
Time
Defines the periods for which inventory is shown. The duration of a period is determined by the interval for enrollment and demand value selected in the forecast configuration.
Period start dates are displayed as rows by default.
RTSM Data Extracts
In forecast calculations with RTSM data extracts, the forecasted inventory report shows actual inventory in the first period. The first period displayed in the report is the period after the period with the RTSM extract date.