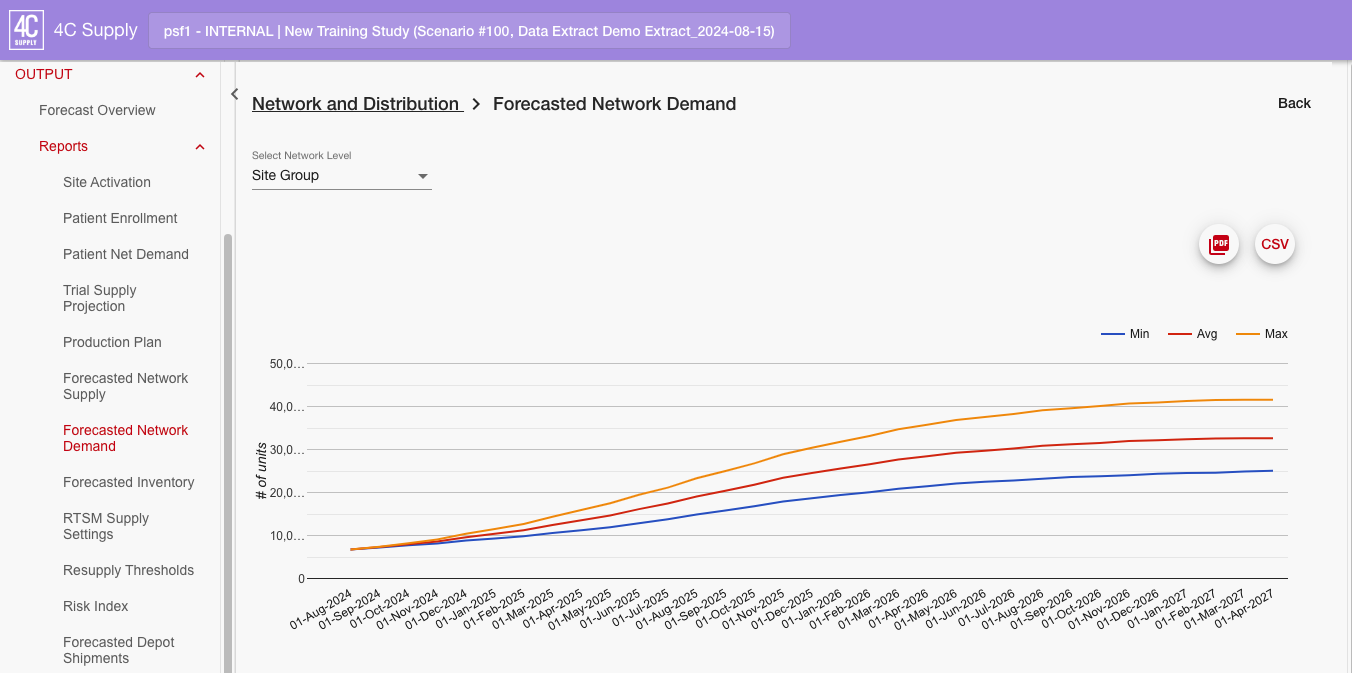
Forecasted Network Demand
Overview
The forecasted network demand report shows cumulative demand over time. Forecasted network demand values are shown with variability, the average value in the final period will equal the total demand displayed in the Trial Supply Projection report. The report data can be shown for different network levels, determined by the report selector (i.e., the Select Network level dropdown).
Example
Report Selectors
Production Facility: Displays forecasted demand at the production facility.
Depot: Displays forecasted quantities required to fulfill demand at depots.
Site Group: Displays forecasted quantities required to fulfill demand at site groups.
Actual Site: Displays actual demand up to the date of the actuals extract and cumulative future demand at an actual site over time.
Average Site: Displays forecasted quantities required to fulfill demand at an average site. An average site is calculated from the total forecasted sites in the selected site group(s).
Note: By default, data is reported in a combined view. Use the relevant filter to select the data required.
Fields and Filters
# of Units
Defines the cumulative quantity of dispensing units shown in the report. Sum of # of Units (default filter) is the cumulative number of units in demand at a depot or region, such that:
Forecasted network demand at the root node depot(s) = demand quantities at the central depot.
Forecasted network demand at a depot = demand quantities at the respective depot.
Forecasted network demand at a site group = demand quantities at the sites in the respective region.
Forecasted network demand at an actual site = demand at an actual site in the respective site group (site shipments) - this is only available when an RTSM extract is loaded.
Forecasted network demand at a average site = demand quantities at an average site (average of selected site group).
# of Packs
If Pack Size is defined in the Dispensing Units table, the # of Packs will be detailed in multiples of the defined pack size. This filter is only visible at the Production Facility and Depot levels.
If no pack size is defined, it a default value of 1 is applied and # of Packs = # of Units
Depot
Determines for which depot(s) data is shown in the report.
Only shown when depot is selected as the network level.
Dispensing Unit
Defines the dispensing unit(s) for which demand quantities are shown. By default, stacked data for all dispensing units is shown in the report. Therefore, it often makes sense to filter for a specific dispensing unit.
Measure
Controls the display of variable data. The report is filtered to show min, max, and average results by default.
Only forecasted demand quantities are represented with variability. Min, max, and average results display as three separate lines on the graph.
Actual demand quantities from the RTSM data extract are shown without variability (displayed as a single point in the period of the extract).
Site Group
Determines for which site group(s) data is shown in the report.
Only shown when average site or site group is selected as the network level.
Quantity
Allows the report grid to display both cumulative demand (Sum of # of Units) quantities alongside the non-cumulative demand quantities (Sum of Qty). These values are also shown for min, max, and average results.
Time
Defines the periods for which demand is shown. The duration of a period is determined by the interval for enrollment and demand value selected in the forecast configuration.
Period start dates are displayed as rows by default.
RTSM Data Extracts
In forecast calculations with RTSM data extracts, the forecasted network demand report shows actual data according to the RTSM extract data (without variability) in the first period. The first period displayed in the report is the period after the period with the RTSM extract date.