Patient Treatment Verification
Introduction
The patient treatment input screen displays in a visual form how the patient journey has been interpreted. The patient journey is shown as a tree with nodes for each event and branches for each possible path the patient can take between nodes. The patient treatment tree is shown in collapsed status by default. Users can expand it using the Expand buttons or by clicking on individual nodes to expand only the children of a particular node.
Each node in the patient treatment tree is annotated with the patient hash (see below) and, depending on the report selector setting, data on visit timing/dispensing/number of patients. Connectors between nodes are annotated with the proportion of patients forecasted to follow the respective connector.
In scenarios with cohorts, regional dispensing or study phases, there are multiple patient treatment trees; one for each cohort, region and study phase. Each patient treatment tree can be accessed using the treatment plan selector.
In forecast calculations with RTSM data extracts, the patient treatment tree shows the actual number of patients to date as well as the total forecasted patients according to the 4C Supply® scenario specification.
Select Treatment Plan
Allows users to select different treatment plans per cohorts, region or study phase. Only shown in scenarios with cohorts, regional dispensing, or study phases
Select Tree Label
Allows users to select which data to display above the nodes of the patient treatment tree:
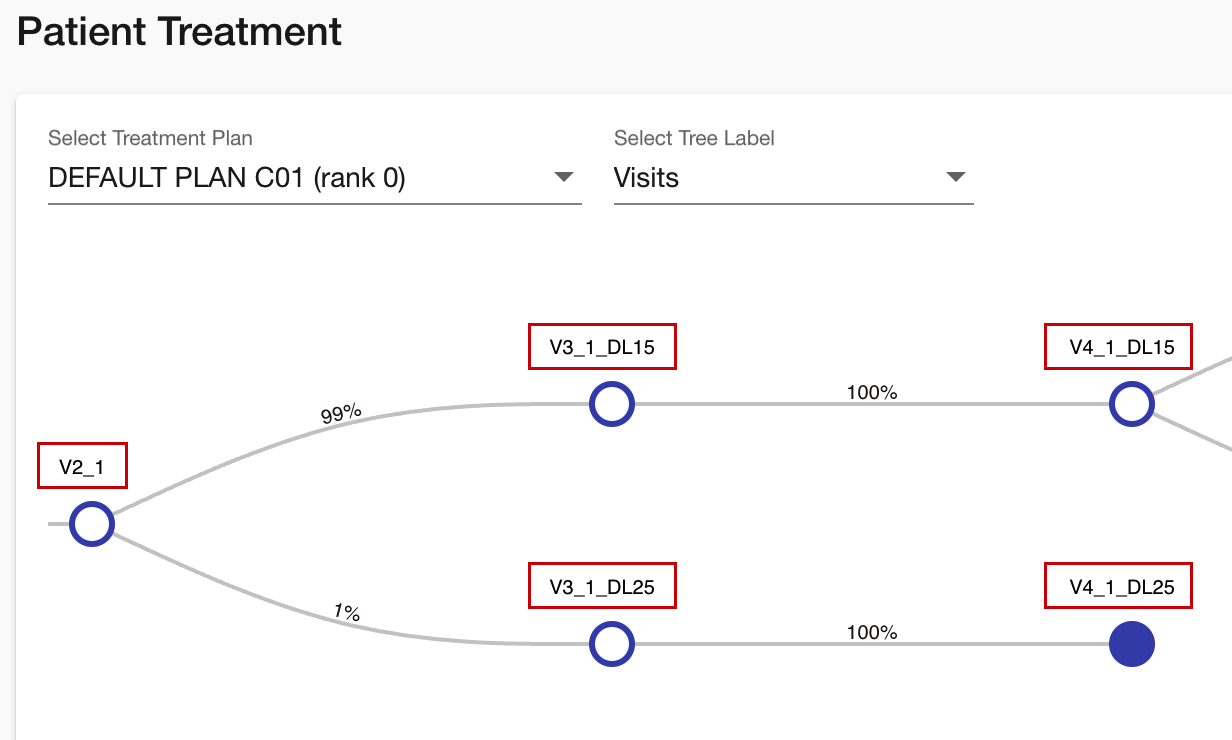
Visits shows the patient hash only (default).
Timing shows the anchor visit, the duration from the anchor visit and the visit window.
Dispensing shows the dispensing details and the patient hash.
Number of patients shows the forecasted numbers of patients and the patient hash. If an RTSM extract has been loaded then the actual number of patients are displayed.
Note: If there is a discrepancy between the number of actual patients represented and the number of patients in the extract the key mapping may need to be updated. If an actual patient’s visit data does not align with the patient treatment tree then they may not be correctly placed on the tree.

Example of a simple patient treatment tree displaying selectable treatment plans and tree labels. The patient hash values are highlighted in red.
Patient Hash
The patient hash is a code specifying the path patients have taken to reach that node. The patient hash is displayed above the node and does not change with the selected Tree Label. The patient hash is a combination of the Visit Code and any values for parameters steering the patient journey, such as randomizations, titrations, or collectible data.
If there is more than one node in the patient treatment tree with the same patient hash, then these are distinguished by adding the number of remaining actions to evaluate at all nodes with the same patient hash except for the first, leading to something like:
V3_1_DL25this is node Visit 3 (V3) for patients in treatment arm 1 (_1) and dose level 25 (_DL25)V2_TA_>50kg_100mgthis is node Visit 2 (V2) for patients in treatment arm 1 (_TA), that are >50kg (_>50kg) and dose level 100mg (_100mg)Note: Patient weight must be set up using a conditional in the Visit Actions table.
V9_TA_B_actions_left_1this is node Visit 3 (V9) for patients in treatment arm 1 (_TA_B) and an undetermined position in relation to future possible pathways.
Generally, the appearance of a patient treatment tree node with a patient hash including actions_left is an indication that there are more pathways patients can take than is intended. This is frequently caused by the order in which visit actions were defined.
There is also a table representation of the patient treatment tree. This is described in the report fields and filters section below, but is more difficult for users to read than the visual representation.
Example

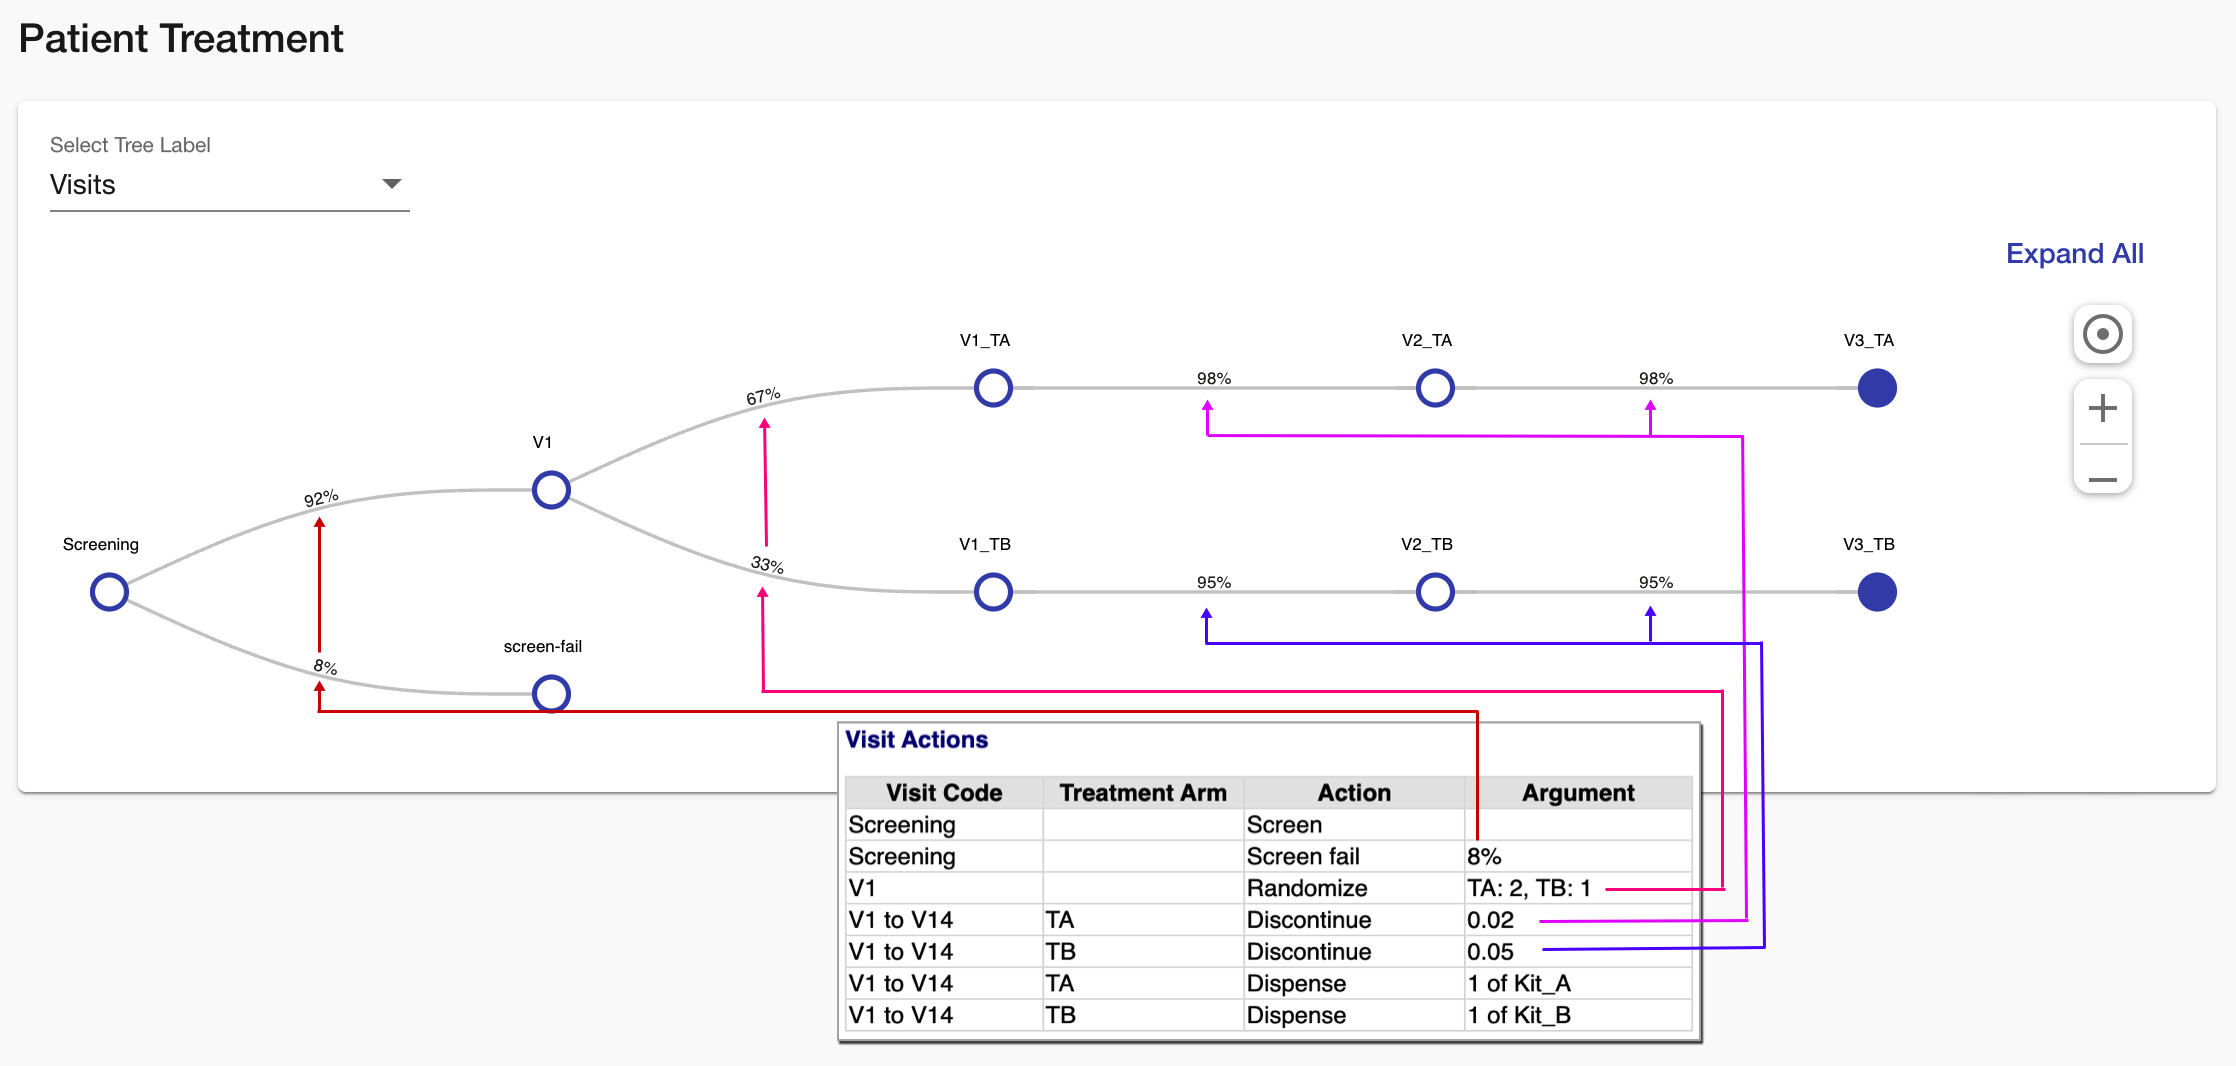
Partially expanded patient treatment tree for a randomized study with screen fail and dropout - the Visit Actions table from the specification overlayed for demonstration purposes.
Report Selectors
Depot
Allows users to only show numbers of actual patients for a specific depot. Only shown if number of patients is selected as tree label and for scenarios with RTSM data extract.
Note: If a depot, region, site group or existing site is selected, only the number of actual patients to date is shown. This is because the number of forecasted patients per depot, region, site group or existing site is only determined during the forecast calculation and is therefore not available for display in the input screens.
Region
Allows users to only show numbers of actual patients for a specific region. Only shown if number of patients is selected as tree label and for scenarios with RTSM data extract.
Note: If a depot, region, site group or existing site is selected, only the number of actual patients to date is shown. This is because the number of forecasted patients per depot, region, site group or existing site is only determined during the forecast calculation and is therefore not available for display in the input screens.
Site Group
Allows users to only show numbers of actual patients for a specific site group. Only shown if number of patients is selected as tree label and for scenarios with RTSM data extract.
Note: If a depot, region, site group or existing site is selected, only the number of actual patients to date is shown. This is because the number of forecasted patients per depot, region, site group or existing site is only determined during the forecast calculation and is therefore not available for display in the input screens.
Existing Site
Allows users to only show numbers of actual patients for a specific existing site. Only shown if number of patients is selected as tree label and for scenarios with RTSM data extract.
Note: If a depot, region, site group or existing site is selected, only the number of actual patients to date is shown. This is because the number of forecasted patients per depot, region, site group or existing site is only determined during the forecast calculation and is therefore not available for display in the input screens.
Report Fields and Filters
Rank
Specifies the position of a visit in the order of the patient journey.
Note: Rank is not always sequential with increments of one because some ranks are not displayed to prevent cluttering of the visual patient treatment tree.
Action
Shows the patient hash of a patient treatment tree node.
Note: The patient hashes shown as action can include more information than the patient hash shown in the patient treatment tree because some nodes (e.g. for dropouts) are not displayed to prevent cluttering of the visual patient treatment tree.
Parent
Specifies the patient hash of the parent node.
Timing Logic
Specifies the timing of a node as [anchor node]+[scheduled days from anchor node]-[window days before scheduled date]+[window days after scheduled date].
Number of Patients
Specified the number of patients calculated to arrive at a node.
Note:
In forecast calculations with RTSM data extract, the actual patients to date and the total forecasted patients as specified in the 4C Supply® scenario specification are shown.
The number of patients is based on simple calculation of patient proportions on patient journey paths, not on enrollment simulation and forecast calculation. Therefore, it is expected that the number of patients in the patient treatment input screen differs from the number of patients shown in the output reports.
End Plan
Specifies whether a node represents the end of a patient journey. Possible values are true and false.
Dispensing
Specifies the quantities and dispensing units of medication forecasted to be allocated.
Short Code
Portion of the patient hash which specifies the visit code.
Note: Some nodes (e.g. dropout) are shown with a short code, but are not displayed in the patient treatment tree.
Titration Code
Portion of the patient hash which specifies the titration level.