Scenario Parameter Comparison
- Introduction
- Examples
- Report Fields and Filters
- Forecasted Depot Shipments
- Forecasted Site Shipments
- Forecasted Study Cost
- Forecasted DP/Comparator Costs
- Forecasted Manufacturing Cost
- Forecasted Logistics Cost
- Forecasted Cost per Patient
- Forecasted Enrollment Start Date
- Forecasted Enrollment Completion Date
- Forecasted Last Dosing Last Patient
- Forecasted Number of Patients Screened
- Forecasted Number of Patients Randomized
- Forecasted Number of Sites Participating
- Forecasted Number of Depots
- Forecasted number of Manufacturing Sites
- Site Buffer Risk Dial Setting
- Manual Overage Percentage
- Computation Interval
- Report Interval
- Total Production Units
- Forecasted Total Scrap Qty
- Forecasted Total Scrap Percentage
Introduction
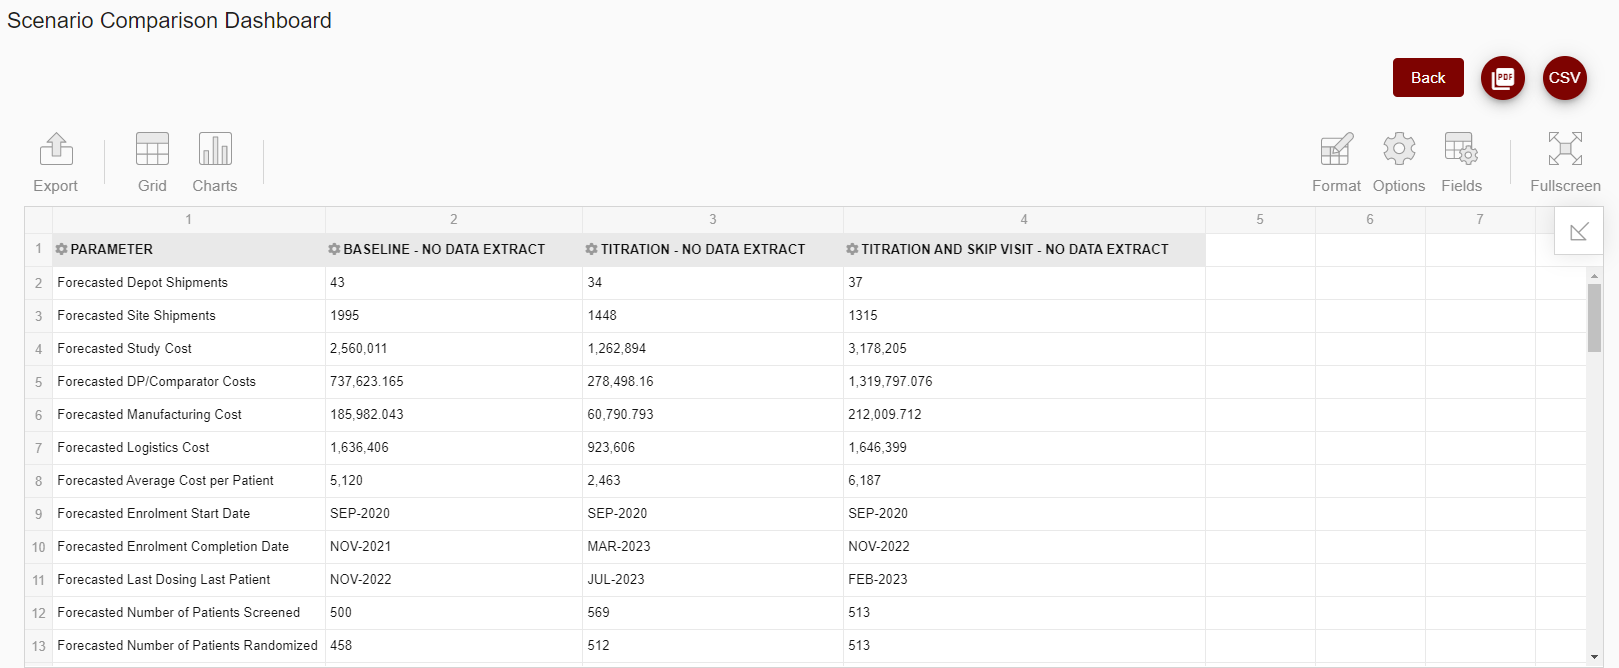
The scenario parameter comparison shows a variety of forecast KPIs in a compact table format. It is therefore particularly adapted to comparisons involving multiple scenarios.
Examples
Scenario parameter comparison for three scenarios without RTSM extract

Report Fields and Filters
Forecasted Depot Shipments
Displays the total forecasted depot shipments for each scenario in the comparison. The values are derived from the forecasted depot level shipments report.
Forecasted Site Shipments
Displays the total forecasted site shipments for each scenario in the comparison. The values are derived from the forecasted site level shipments report.
Forecasted Study Cost
Displays the total forecasted study cost for each scenario in the comparison. The values are derived from the forecasted study cost report.
Forecasted DP/Comparator Costs
Displays the total forecasted drug product and comparator cost for each scenario in the comparison. The values are derived from the forecasted DP and material cost report.
Forecasted Manufacturing Cost
Displays the total forecasted manufacturing cost for each scenario in the comparison. The values are derived from the forecasted DP and material cost report.
Forecasted Logistics Cost
Displays the total forecasted storage and distribution cost for each scenario in the comparison. The values are derived from the forecasted storage and distribution cost report.
Forecasted Cost per Patient
Displays the forecasted average cost per patient for each scenario in the comparison. The displayed value is the total study cost as derived from the forecasted study cost report divided by the total number of patients screened.
Forecasted Enrollment Start Date
Displays the forecasted period with first enrollment for each scenario in the comparison. The displayed value is the start date of the first period in the patient enrollment report which has data.
Forecasted Enrollment Completion Date
Displays the forecasted period with last enrollment for each scenario in the comparison. The displayed value is the start date of the last period in the patient enrollment report with an increase in screened patients.
Forecasted Last Dosing Last Patient
Displays the forecasted period with last dispensing for each scenario in the comparison. The displayed value is the start date of the last period in the unconstrained patient net demand report with an increase in dispensed kits.
Forecasted Number of Patients Screened
Displays the total forecasted number of screened patients for each scenario in the comparison. The values are derived from the patient enrollment report.
Forecasted Number of Patients Randomized
Displays the total forecasted number of randomized patients for each scenario in the comparison. The values are derived from the patient enrollment report.
Forecasted Number of Sites Participating
Displays the total forecasted number of participating sites for each scenario in the comparison. The displayed value is the sum of sites as specified in the site groups table.
Forecasted Number of Depots
Displays the total forecasted number of participating depots for each scenario in the comparison. The displayed value is the sum of depots as specified in the depots table.
Forecasted number of Manufacturing Sites
Displays the total number of manufacturing site (= release locations) for each scenario in the comparison. The displayed value is the number of release location specified in the dispensing units table.
Site Buffer Risk Dial Setting
Displays the selected site buffer confidence level for each scenario in the comparison. The values are derived from the forecast overview.
Manual Overage Percentage
Displays the selected manual overage for each scenario in the comparison. The values are derived from the forecast overview.
Computation Interval
Displays the selected interval of days used in the forecast calculation.
Report Interval
Displays the selected interval of days used in the forecast reports.
Total Production Units
Displays the total forecasted number of produced kits per dispensing unit for each scenario in the comparison. The values are derived from the production plan. Identical dispensing unit codes are aligned across scenarios.
Forecasted Total Scrap Qty
Displays the total forecasted scrap per dispensing unit for each scenario in the comparison using average values from the variability calculation. The values are derived from the forecast overview. Identical dispensing unit codes are aligned across scenarios.
Forecasted Total Scrap Percentage
Displays the total forecasted scrap in percent per dispensing unit for each scenario in the comparison average values from the variability calculation. The values are derived from the forecast overview. Identical dispensing unit codes are aligned across scenarios