Aggregated Shipment Forecast
Introduction
The aggregated shipments forecast shows aggregated shipment quantities over time for multiple scenarios. In forecast calculations with RTSM data extract, only shipments forecasted by 4C Supply® are shown in the shipment forecast.
Among others, the aggregated shipment forecast can be used to determine the forecasted shipment quantities in a shipping lane across multiple studies.
Notes
Data is aggregated on multiple levels in the aggregated shipment forecast:
Shipment types are aggregated by shipment type code. Therefore, users must choose common shipment type codes for shipment types where aggregation is intended.
Depots are aggregated by depot code. Therefore, users must choose common depot codes for depots where aggregation is intended.
Examples
Aggregated shipment forecast graph of two studies without RTSM actuals

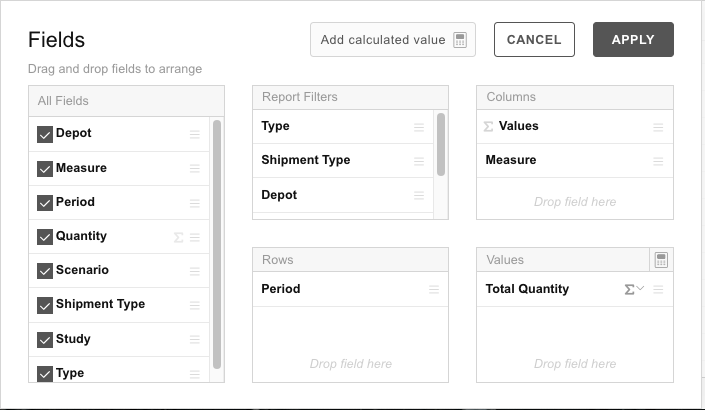
Report Fields and Filters

Type
Definition
Defines if depot-depot shipments, depot-site shipments or both are shown.
Rules
Shown as report filter by default.
Study
Definition
Determines for which study/studies data is shown in the report.
Rules
Shown as report column by default.
Scenario
Definition
Determines for which scenario(s) data is shown in the report.
Rules
Shown as report column by default.
Depot
Definition
Defines the depot(s) for which depot shipments are shown.
Rules
Shown as columns by default.
Measure
Definition
The average number of shipments as calculated by the forecasting algorithm.
Rules
Shown as column by default.
Only average value is calculated and displayed for shipments.
Shipment Type
Definition
Defines the shipment types considered in the depots shipments count.
Rules
Shown as columns by default.
Period
Definition
Defines the periods in which produced kits are released.
Rules
Period start dates are displayed.
Notes
The size of periods is determined by the interval for enrollment and demand value selected in the forecast configuration.
Quantity
Definition
Quantity of shipments shown in the report.
Rules
Shown as values by default.