Site Activation
Overview
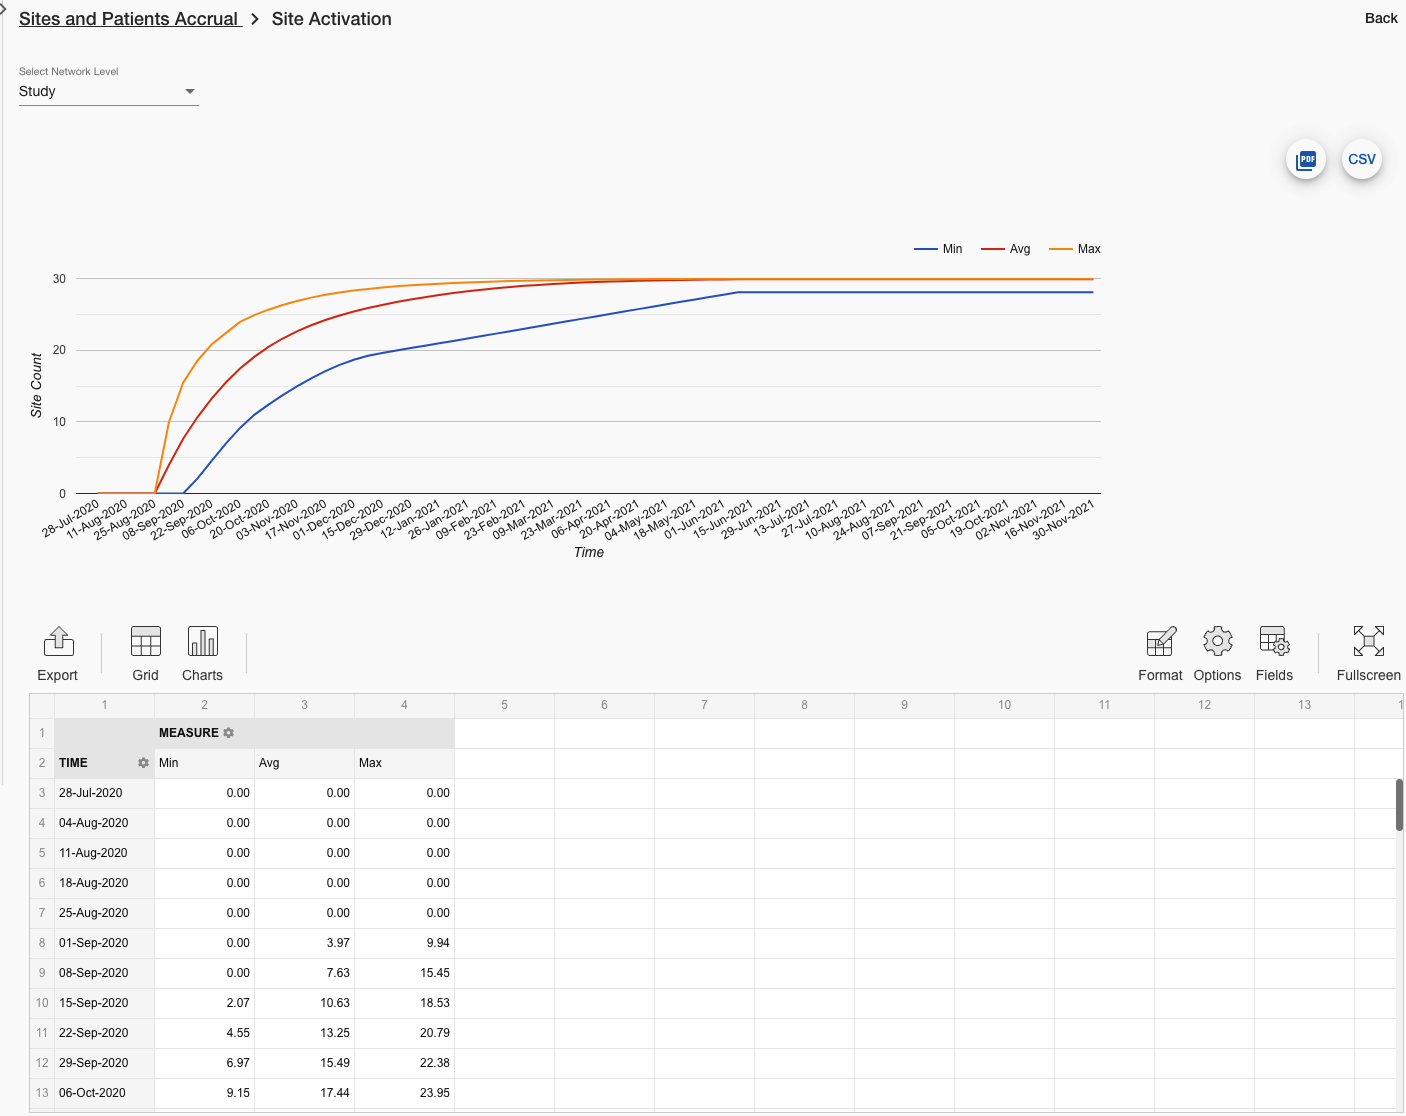
The Site Activation report displays cumulative site activation data over time. When the information for site activation is entered in a Site Activation table or in a Site Groups table the data is reported with variability. When a Fixed Site Activation table is used, the report will not include variability and the results reported will match the data input in the specification. The ‘Select Network Level’ dropdown determines which data to display, the default is a combined view of the study.
Example

Example Site Activations report
Report Selectors
Study: Displays site activation data for the entire study.
Depot: Displays site activation data in relation to depots.
Region: Displays site activation data in relation to regions.
Site Group: Displays site activation data in relation to site groups.
Site Activation variability is reported for each Depot, Site Group, Region, and Cohort independently within our system. This allows for a detailed understanding of the potential range of Site Activation figures at these organizational levels but also means that:
The combined total displayed when viewing Depot, Site Group, Region, or Cohort will not equal the Study level view.
The average value remains consistent across all reports.
Minimum and maximum values are only meaningful when a single entity (Depot, Site Group, Region, or Cohort) is selected.
Note: This is not relevant if a Fixed Site Activation table is used, as this prevents the system from applying variability.
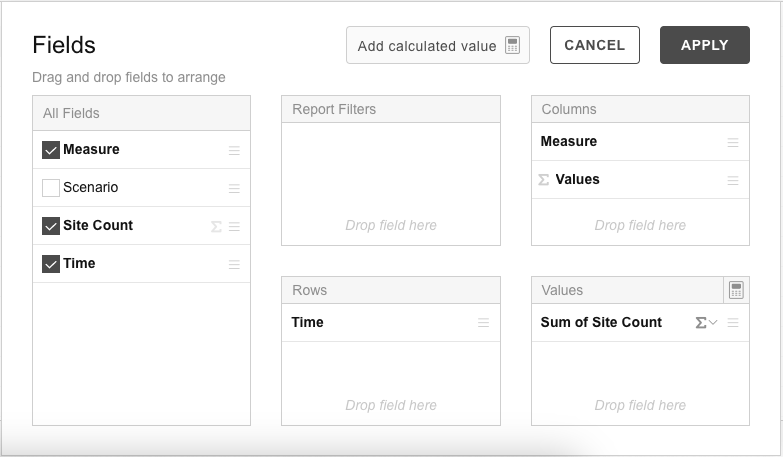
Fields and Filters

The default fields for the Site Activation report
Depot
Determines which depot(s) data is reported.
Only shown when ‘Depot’ is selected as the network level.
Data is combined by default. Use the filter to limit the report to the required data.
Measure
Determines which data output (min/max/average) is reported. Min, max, and average results are included by default.
Only forecasted site activations are represented with variability. Min, max, and average results are displayed as three separate lines on the graph.
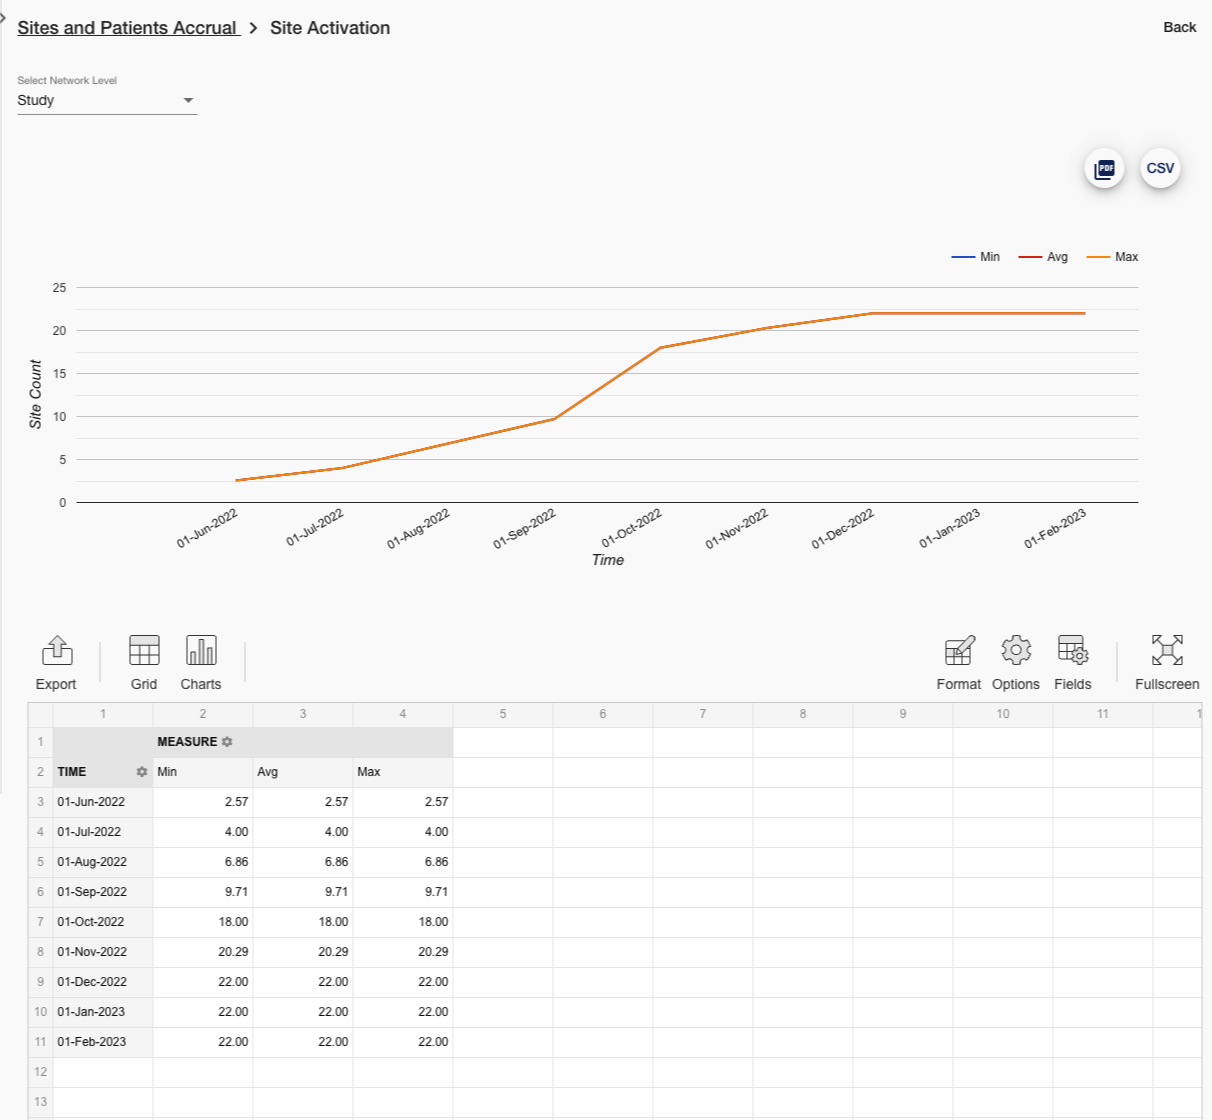
Actual site activations imported from the RTSM data extract are shown without variability and display as a single line.
Region
Determines which region(s) data is reported.
Only shown when ‘Region’ is selected as the network level.
Data is combined by default. Use the filter to limit the report to the required data.
Site Count
Reports the number of sites activated by period. Displayed as a total sum by default.
Site Group
Determines which site group(s) data is shown in the report.
Only shown when ‘Site Group' is selected as the network level.
Data is combined by default. Use the filter to limit the report to the required data.
Time
Reports the start date of the period for which site activation data is shown. The duration of a period is determined by the interval for enrollment and demand value selected in the forecast configuration.
Periods are displayed as rows by default.
RTSM Data Extracts
In forecast calculations with RTSM data extracts, the site activation report shows actual data according to the RTSM extract data (without variability).

Example Site Activations report with RTSM extract data